
Page 278 - Read Online
P. 278
Duparchy et al. Energy Mater. 2025, 5, 500134 https://dx.doi.org/10.20517/energymater.2025.51 Page 15 of 21
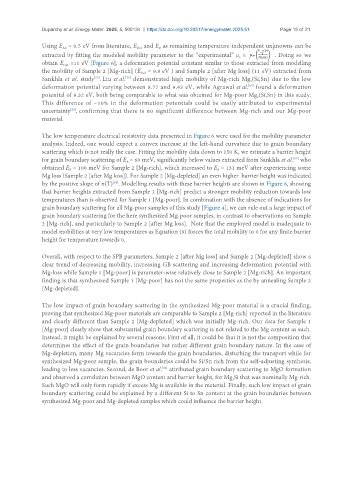
Using E = 0.5 eV from literature, E and E as remaining temperature-independent unknowns can be
B
AS
Def
extracted by fitting the modeled mobility parameter to the “experimental” μ = . Doing so we
0
obtain E =11 eV [Figure 6], a deformation potential constant similar to those extracted from modelling
Def
the mobility of Sample 2 [Mg-rich] (E = 9.8 eV ) and Sample 2 [after Mg loss] (11 eV) extracted from
Def
Sankhla et al. study . Liu et al. demonstrated high mobility of Mg-rich Mg (Si,Sn) due to the low
[76]
[57]
2
deformation potential varying between 8.77 and 9.43 eV, while Agrawal et al. found a deformation
[85]
potential of 9.32 eV, both being comparable to what was obtained for Mg-poor Mg (Si,Sn) in this study.
2
This difference of ~10% in the deformation potentials could be easily attributed to experimental
uncertainty , confirming that there is no significant difference between Mg-rich and our Mg-poor
[59]
material.
The low temperature electrical resistivity data presented in Figure 6 were used for the mobility parameter
analysis. Indeed, one would expect a convex increase at the left-hand curvature due to grain boundary
scattering which is not really the case. Fitting the mobility data down to 150 K, we estimate a barrier height
for grain boundary scattering of E = 60 meV, significantly below values extracted from Sankhla et al. who
[57]
B
obtained E = 100 meV for Sample 2 [Mg-rich], which increased to E = 131 meV after experiencing some
B
B
Mg loss {Sample 2 [after Mg loss]}. For Sample 2 [Mg-depleted] an even higher barrier height was indicated
by the positive slope of σ(T) . Modelling results with these barrier heights are shown in Figure 6, showing
[34]
that barrier heights extracted from Sample 2 [Mg-rich] predict a stronger mobility reduction towards low
temperatures than is observed for Sample 1 [Mg-poor]. In combination with the absence of indications for
grain boundary scattering for all Mg-poor samples of this study [Figure 4], we can rule out a large impact of
grain boundary scattering for the here synthesized Mg-poor samples, in contrast to observations on Sample
2 [Mg-rich], and particularly to Sample 2 [after Mg loss]. Note that the employed model is inadequate to
model mobilities at very low temperatures as Equation (9) forces the total mobility to 0 for any finite barrier
height for temperature towards 0.
Overall, with respect to the SPB parameters, Sample 2 [after Mg loss] and Sample 2 [Mg-depleted] show a
clear trend of decreasing mobility, increasing GB scattering and increasing deformation potential with
Mg-loss while Sample 1 [Mg-poor] is parameter-wise relatively close to Sample 2 [Mg-rich]. An important
finding is that synthesized Sample 1 [Mg-poor] has not the same properties as the by annealing Sample 2
[Mg-depleted].
The low impact of grain boundary scattering in the synthesized Mg-poor material is a crucial finding,
proving that synthesized Mg-poor materials are comparable to Sample 2 [Mg-rich] reported in the literature
and clearly different than Sample 2 [Mg-depleted] which was initially Mg-rich. Our data for Sample 1
[Mg-poor] clearly show that substantial grain boundary scattering is not related to the Mg content as such.
Instead, it might be explained by several reasons. First of all, it could be that it is not the composition that
determines the effect of the grain boundaries but rather different grain boundary nature. In the case of
Mg-depletion, many Mg vacancies form towards the grain boundaries, disturbing the transport while for
synthesized Mg-poor sample, the grain boundaries could be Si/Sn rich from the self-adjusting synthesis,
leading to less vacancies. Second, de Boor et al. attributed grain boundary scattering to MgO formation
[86]
and observed a correlation between MgO content and barrier height, for Mg Si that was nominally Mg-rich.
2
Such MgO will only form rapidly if excess Mg is available in the material. Finally, such low impact of grain
boundary scattering could be explained by a different Si to Sn content at the grain boundaries between
synthesized Mg-poor and Mg-depleted samples which could influence the barrier height.