
Page 279 - Read Online
P. 279
Page 16 of 21 Duparchy et al. Energy Mater. 2025, 5, 500134 https://dx.doi.org/10.20517/energymater.2025.51
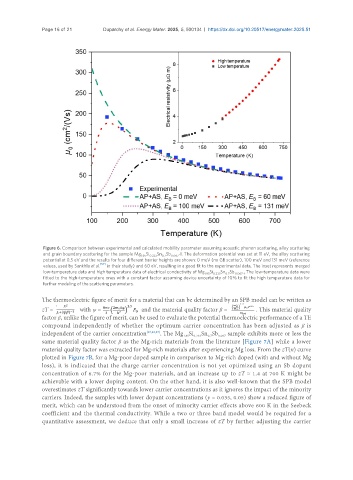
Figure 6. Comparison between experimental and calculated mobility parameter assuming acoustic phonon scattering, alloy scattering
and grain boundary scattering for the sample Mg 1.95 Si 0.233 Sn Sb 0.067 -I. The deformation potential was set at 11 eV, the alloy scattering
0.7
potential at 0.5 eV and the results for four different barrier heights are shown: 0 meV (no GB scatter), 100 meV and 131 meV (reference
values, used by Sankhla et al. [57] in their study) and 60 eV, resulting in a good fit to the experimental data. The inset represents merged
low-temperature data and high temperature data of electrical conductivity of Mg 1.95 Si 0.233 Sn Sb 0.067-I . The low-temperature data were
0.7
fitted to the high-temperature ones with a constant factor assuming device uncertainty of 10% to fit the high temperature data for
further modeling of the scattering parameters.
The thermoelectric figure of merit for a material that can be determined by an SPB model can be written as
zT = with ψ = and the material quality factor β = . This material quality
factor β, unlike the figure of merit, can be used to evaluate the potential thermoelectric performance of a TE
compound independently of whether the optimum carrier concentration has been adjusted as β is
independent of the carrier concentration [57,58,87] . The Mg Si 0.233 Sn Sb 0.067 sample exhibits more or less the
1.95
0.7
same material quality factor β as the Mg-rich materials from the literature [Figure 7A] while a lower
material quality factor was extracted for Mg-rich materials after experiencing Mg loss. From the zT(n) curve
plotted in Figure 7B, for a Mg-poor doped sample in comparison to Mg-rich doped (with and without Mg
loss), it is indicated that the charge carrier concentration is not yet optimized using an Sb dopant
concentration of 6.7% for the Mg-poor materials, and an increase up to zT ≈ 1.4 at 700 K might be
achievable with a lower doping content. On the other hand, it is also well-known that the SPB model
overestimates zT significantly towards lower carrier concentrations as it ignores the impact of the minority
carriers. Indeed, the samples with lower dopant concentrations (y = 0.035, 0.05) show a reduced figure of
merit, which can be understood from the onset of minority carrier effects above 600 K in the Seebeck
coefficient and the thermal conductivity. While a two or three band model would be required for a
quantitative assessment, we deduce that only a small increase of zT by further adjusting the carrier