
Page 273 - Read Online
P. 273
Page 10 of 21 Duparchy et al. Energy Mater. 2025, 5, 500134 https://dx.doi.org/10.20517/energymater.2025.51
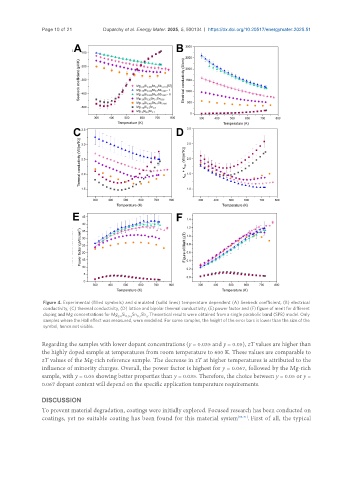
Figure 4. Experimental (filled symbols) and simulated (solid lines) temperature dependent (A) Seebeck coefficient, (B) electrical
conductivity, (C) thermal conductivity, (D) lattice and bipolar thermal conductivity, (E) power factor and (F) figure of merit for different
doping and Mg concentrations for Mg Si 0.3-y Sn Sb . Theoretical results were obtained from a single parabolic band (SPB) model. Only
2-δ
y
0.7
samples where the Hall effect was measured, were modelled. For some samples, the height of the error bars is lower than the size of the
symbol, hence not visible.
Regarding the samples with lower dopant concentrations (y = 0.035 and y = 0.05), zT values are higher than
the highly doped sample at temperatures from room temperature to 600 K. These values are comparable to
zT values of the Mg-rich reference sample. The decrease in zT at higher temperatures is attributed to the
influence of minority charges. Overall, the power factor is highest for y = 0.067, followed by the Mg-rich
sample, with y = 0.05 showing better properties than y = 0.035. Therefore, the choice between y = 0.05 or y =
0.067 dopant content will depend on the specific application temperature requirements.
DISCUSSION
To prevent material degradation, coatings were initially explored. Focused research has been conducted on
coatings, yet no suitable coating has been found for this material system [68-71] . First of all, the typical