
Page 269 - Read Online
P. 269
Page 6 of 21 Duparchy et al. Energy Mater. 2025, 5, 500134 https://dx.doi.org/10.20517/energymater.2025.51
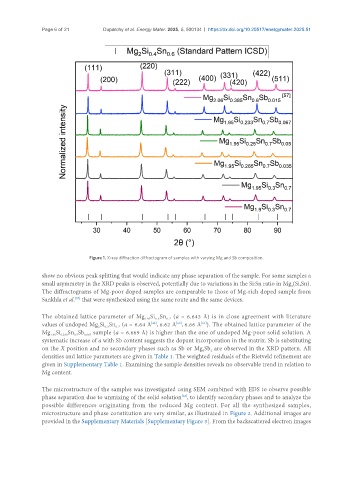
Figure 1. X-ray diffraction diffractogram of samples with varying Mg and Sb composition.
show no obvious peak splitting that would indicate any phase separation of the sample. For some samples a
small asymmetry in the XRD peaks is observed, potentially due to variations in the Si:Sn ratio in Mg (Si,Sn).
2
The diffractograms of Mg-poor doped samples are comparable to those of Mg-rich doped sample from
[57]
Sankhla et al. that were synthesized using the same route and the same devices.
The obtained lattice parameter of Mg Si Sn (a = 6.643 Å) is in close agreement with literature
0.7
0.3
1.95
[46]
values of undoped Mg Si Sn (a = 6.64 Å , 6.62 Å , 6.66 Å ). The obtained lattice parameter of the
[61]
[60]
2
0.7
0.3
Mg Si Sn Sb sample (a = 6.669 Å) is higher than the one of undoped Mg-poor solid solution. A
0.067
1.95
0.233
0.7
systematic increase of a with Sb content suggests the dopant incorporation in the matrix. Sb is substituting
on the X position and no secondary phases such as Sb or Mg Sb are observed in the XRD pattern. All
3
2
densities and lattice parameters are given in Table 1. The weighted residuals of the Rietveld refinement are
given in Supplementary Table 1. Examining the sample densities reveals no observable trend in relation to
Mg content.
The microstructure of the samples was investigated using SEM combined with EDS to observe possible
phase separation due to unmixing of the solid solution , to identify secondary phases and to analyze the
[62]
possible differences originating from the reduced Mg content. For all the synthesized samples,
microstructure and phase constitution are very similar, as illustrated in Figure 2. Additional images are
provided in the Supplementary Materials [Supplementary Figure 3]. From the backscattered electron images