
Page 271 - Read Online
P. 271
Page 8 of 21 Duparchy et al. Energy Mater. 2025, 5, 500134 https://dx.doi.org/10.20517/energymater.2025.51
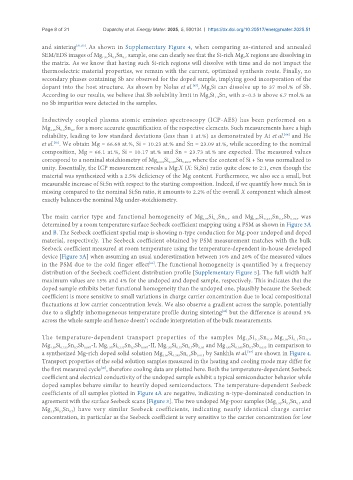
and sintering [31,63] . As shown in Supplementary Figure 4, when comparing as-sintered and annealed
SEM/EDS images of Mg Si Sn sample, one can clearly see that the Si-rich Mg X regions are dissolving in
0.7
2
1.95
0.3
the matrix. As we know that having such Si-rich regions will dissolve with time and do not impact the
thermoelectric material properties, we remain with the current, optimized synthesis route. Finally, no
secondary phases containing Sb are observed for the doped sample, implying good incorporation of the
dopant into the host structure. As shown by Nolas et al. , Mg Si can dissolve up to 37 mol.% of Sb.
[47]
2
According to our results, we believe that Sb solubility limit in Mg Si Sn with x~0.3 is above 6.7 mol.% as
2
1-x
x
no Sb impurities were detected in the samples.
Inductively coupled plasma atomic emission spectroscopy (ICP-AES) has been performed on a
Mg Si Sn for a more accurate quantification of the respective elements. Such measurements have a high
1.95
0.3
0.7
reliability, leading to low standard deviations (less than 1 at.%) as demonstrated by Ai et al. and He
[64]
[65]
et al. . We obtain Mg = 66.68 at.%, Si = 10.23 at.% and Sn = 23.09 at.%, while according to the nominal
composition, Mg = 66.1 at.%, Si = 10.17 at.% and Sn = 23.73 at.% are expected. The measured values
correspond to a nominal stoichiometry of Mg Si Sn , where the content of Si + Sn was normalized to
0.307
0.693
2.001
unity. Essentially, the ICP measurement reveals a Mg:X (X: Si,Sn) ratio quite close to 2:1, even though the
material was synthesized with a 2.5% deficiency of the Mg content. Furthermore, we also see a small, but
measurable increase of Si:Sn with respect to the starting composition. Indeed, if we quantify how much Sn is
missing compared to the nominal Si:Sn ratio, it amounts to 2.2% of the overall X component which almost
exactly balances the nominal Mg under-stoichiometry.
The main carrier type and functional homogeneity of Mg Si Sn and Mg Si 0.233 Sn Sb 0.067 was
0.3
0.7
1.95
1.95
0.7
determined by a room temperature surface Seebeck coefficient mapping using a PSM as shown in Figure 3A
and B. The Seebeck coefficient spatial map is showing n-type conduction for Mg-poor undoped and doped
material, respectively. The Seebeck coefficient obtained by PSM measurement matches with the bulk
Seebeck coefficient measured at room temperature using the temperature-dependent in-house developed
device [Figure 3A] when assuming an usual underestimation between 10% and 20% of the measured values
in the PSM due to the cold finger effect . The functional homogeneity is quantified by a frequency
[66]
distribution of the Seebeck coefficient distribution profile [Supplementary Figure 5]. The full width half
maximum values are 15% and 4% for the undoped and doped sample, respectively. This indicates that the
doped sample exhibits better functional homogeneity than the undoped one, plausibly because the Seebeck
coefficient is more sensitive to small variations in charge carrier concentration due to local compositional
fluctuations at low carrier concentration levels. We also observe a gradient across the sample, potentially
due to a slightly inhomogeneous temperature profile during sintering but the difference is around 5%
[46]
across the whole sample and hence doesn’t occlude interpretation of the bulk measurements.
The temperature-dependent transport properties of the samples Mg Si Sn , Mg Si Sn ,
0.3
1.9
1.95
0.7
0.7
0.3
Mg Si Sn Sb -I, Mg Si Sn Sb -II, Mg Si Sn Sb and Mg Si Sn Sb in comparison to
0.265
0.7
0.7
0.035
0.05
1.95
0.067
1.95
0.233
1.95
0.233
0.7
1.95
0.25
0.7
0.067
[57]
a synthesized Mg-rich doped solid solution Mg Si 0.385 Sn Sb 0.015 by Sankhla et al. are shown in Figure 4.
0.6
2.06
Transport properties of the solid solution samples measured in the heating and cooling mode may differ for
the first measured cycle , therefore cooling data are plotted here. Both the temperature-dependent Seebeck
[46]
coefficient and electrical conductivity of the undoped sample exhibit a typical semiconductor behavior while
doped samples behave similar to heavily doped semiconductors. The temperature-dependent Seebeck
coefficients of all samples plotted in Figure 4A are negative, indicating n-type-dominated conduction in
agreement with the surface Seebeck scans [Figure 3]. The two undoped Mg-poor samples (Mg Si Sn and
1.95
0.7
0.3
Mg Si Sn ) have very similar Seebeck coefficients, indicating nearly identical charge carrier
0.3
0.7
1.9
concentration, in particular as the Seebeck coefficient is very sensitive to the carrier concentration for low