
Page 272 - Read Online
P. 272
Duparchy et al. Energy Mater. 2025, 5, 500134 https://dx.doi.org/10.20517/energymater.2025.51 Page 9 of 21
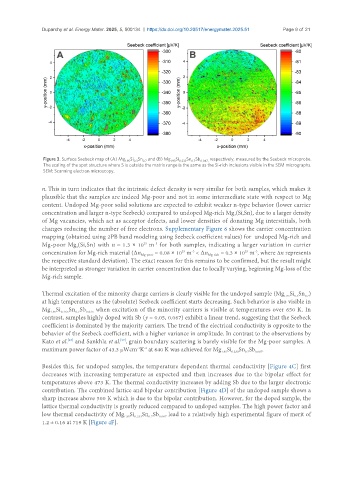
Figure 3. Surface Seebeck map of (A) Mg Si Sn and (B) Mg Si Sn Sb respectively, measured by the Seebeck microprobe.
1.95 0.3 0.7 1.95 0.233 0.7 0.067,
The scaling of the spot structure where S is outside the matrix range is the same as the Si-rich inclusions visible in the SEM micrographs.
SEM: Scanning electron microscopy.
n. This in turn indicates that the intrinsic defect density is very similar for both samples, which makes it
plausible that the samples are indeed Mg-poor and not in some intermediate state with respect to Mg
content. Undoped Mg-poor solid solutions are expected to exhibit weaker n-type behavior (lower carrier
concentration and larger n-type Seebeck) compared to undoped Mg-rich Mg (Si,Sn), due to a larger density
2
of Mg vacancies, which act as acceptor defects, and lower densities of donating Mg interstitials, both
changes reducing the number of free electrons. Supplementary Figure 6 shows the carrier concentration
mapping (obtained using 2PB band modeling using Seebeck coefficient values) for undoped Mg-rich and
Mg-poor Mg (Si,Sn) with n ≈ 1.3 × 10 m for both samples, indicating a larger variation in carrier
-3
25
2
25
-3
-3
25
concentration for Mg-rich material (∆n Mg-poor = 0.08 × 10 m < ∆n Mg-rich = 0.3 × 10 m , where Δn represents
the respective standard deviation). The exact reason for this remains to be confirmed, but the result might
be interpreted as stronger variation in carrier concentration due to locally varying, beginning Mg-loss of the
Mg-rich sample.
Thermal excitation of the minority charge carriers is clearly visible for the undoped sample (Mg Si Sn )
0.3
0.7
1.95
at high temperatures as the (absolute) Seebeck coefficient starts decreasing. Such behavior is also visible in
Mg Si 0.265 Sn Sb 0.035 when excitation of the minority carriers is visible at temperatures over 650 K. In
0.7
1.95
contrast, samples highly doped with Sb (y = 0.05, 0.067) exhibit a linear trend, suggesting that the Seebeck
coefficient is dominated by the majority carriers. The trend of the electrical conductivity is opposite to the
behavior of the Seebeck coefficient, with a higher variance in amplitude. In contrast to the observations by
Kato et al. and Sankhla et al. , grain boundary scattering is barely visible for the Mg-poor samples. A
[67]
[57]
-2
maximum power factor of 43.3 µWcm K at 640 K was achieved for Mg Si Sn Sb .
-1
1.95
0.233
0.067
0.7
Besides this, for undoped samples, the temperature dependent thermal conductivity [Figure 4C] first
decreases with increasing temperature as expected and then increases due to the bipolar effect for
temperatures above 473 K. The thermal conductivity increases by adding Sb due to the larger electronic
contribution. The combined lattice and bipolar contribution [Figure 4D] of the undoped sample shows a
sharp increase above 500 K which is due to the bipolar contribution. However, for the doped sample, the
lattice thermal conductivity is greatly reduced compared to undoped samples. The high power factor and
low thermal conductivity of Mg Si 0.233 Sn Sb 0.067 lead to a relatively high experimental figure of merit of
1.95
0.7
1.2 ± 0.16 at 719 K [Figure 4F].