
Page 14 - Read Online
P. 14
Page 10 of 14 Zhuang et al. Energy Mater. 2025, 5, 500015 https://dx.doi.org/10.20517/energymater.2024.90
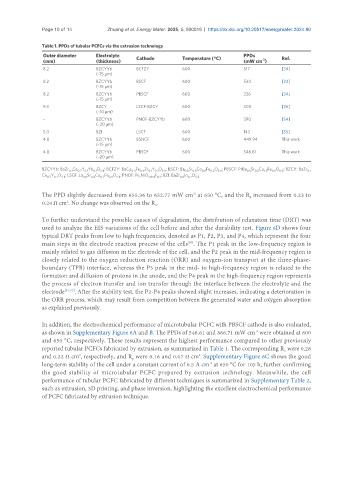
Table 1. PPDs of tubular PCFCs via the extrusion technology
Outer diameter Electrolyte Cathode Temperature (°C) PPDs Ref.
-2
(mm) (thickness) (mW cm )
8.2 BZCYYb BCFZY 600 517 [34]
(~15 μm)
8.2 BZCYYb BSCF 600 534 [34]
(~15 μm)
8.2 BZCYYb PBSCF 600 326 [34]
(~15 μm)
9.3 BZCY LSCF-BZCY 600 300 [26]
(~10 μm)
– BZCYYb PNOF-BZCYYb 600 390 [54]
(~20 μm)
5.0 BZI LSCF 600 143 [55]
4.8 BZCYYb BSNCF 600 449.94 This work
(~15 μm)
4.8 BZCYYb PBSCF 600 546.61 This work
(~20 μm)
BZCYYb: BaZr Ce Y Yb O ; BCFZY: BaCo Fe Zr Y O ; BSCF: Ba Sr Co Fe O ; PBSCF: PrBa Sr Co Fe O ; BZCY: BaZr
0.1 0.7 0.1 0.1 3-δ 0.4 0.4 0.1 0.1 3-δ 0.5 0.5 0.8 0.2 3-δ 0.5 0.5 1.5 0.5 6-δ 0.1
Ce Y O ; LSCF: La Sr Co Fe O ; PNOF: Pr NiO F ; BZI: BaZr In O
0.7 0.2 3-δ 0.6 0.4 0.2 0.8 3-δ 2 3.9+δ 0.1 0.8 0.2 3-δ
-2
The PPD slightly decreased from 655.36 to 632.77 mW cm at 650 °C, and the R increased from 0.23 to
p
2
0.24 Ω cm . No change was observed on the R .
o
To further understand the possible causes of degradation, the distribution of relaxation time (DRT) was
used to analyze the EIS variations of the cell before and after the durability test. Figure 6D shows four
typical DRT peaks from low to high frequencies, denoted as P1, P2, P3, and P4, which represent the four
main steps in the electrode reaction process of the cells . The P1 peak in the low-frequency region is
[50]
mainly related to gas diffusion in the electrode of the cell, and the P2 peak in the mid-frequency region is
closely related to the oxygen reduction reaction (ORR) and oxygen-ion transport at the three-phase-
boundary (TPB) interface, whereas the P3 peak in the mid- to high-frequency region is related to the
formation and diffusion of protons in the anode, and the P4 peak in the high-frequency region represents
the process of electron transfer and ion transfer through the interface between the electrolyte and the
electrode [51-53] . After the stability test, the P2-P4 peaks showed slight increases, indicating a deterioration in
the ORR process, which may result from competition between the generated water and oxygen absorption
as explained previously.
In addition, the electrochemical performance of microtubular PCFC with PBSCF cathode is also evaluated,
as shown in Supplementary Figure 6A and B. The PPDs of 546.61 and 866.71 mW cm were obtained at 600
-2
and 650 °C, respectively. These results represent the highest performance compared to other previously
reported tubular PCFCs fabricated by extrusion, as summarized in Table 1. The corresponding R were 0.28
o
and 0.22 Ω cm , respectively, and R were 0.16 and 0.07 Ω cm . Supplementary Figure 6C shows the good
2
2
p
-2
long-term stability of the cell under a constant current of 0.5 A cm at 650 °C for 105 h, further confirming
the good stability of microtubular PCFC prepared by extrusion technology. Meanwhile, the cell
performance of tubular PCFC fabricated by different techniques is summarized in Supplementary Table 2,
such as extrusion, 3D printing, and phase inversion, highlighting the excellent electrochemical performance
of PCFC fabricated by extrusion technique.