
Page 13 - Read Online
P. 13
Zhuang et al. Energy Mater. 2025, 5, 500015 https://dx.doi.org/10.20517/energymater.2024.90 Page 9 of 14
Figure 5. (A) XRD pattern of BSNCF; (B) The TEC of BSNCF measured at room temperature to 1,000 °C; (C) The TECs comparison of
BZCYYb1711 electrolyte with other commonly used cathode materials.
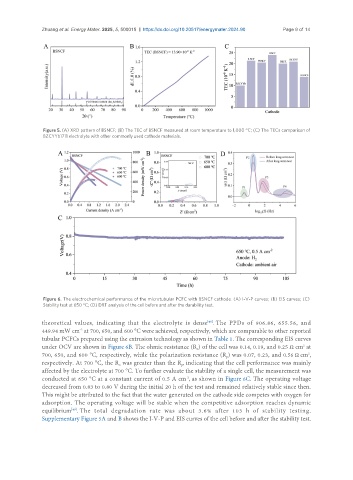
Figure 6. The electrochemical performance of the microtubular PCFC with BSNCF cathode. (A) I-V-P curves; (B) EIS curves; (C)
Stability test at 650 °C; (D) DRT analysis of the cell before and after the durability test.
[48]
theoretical values, indicating that the electrolyte is dense . The PPDs of 906.86, 655.56, and
449.94 mW cm at 700, 650, and 600 °C were achieved, respectively, which are comparable to other reported
-2
tubular PCFCs prepared using the extrusion technology as shown in Table 1. The corresponding EIS curves
under OCV are shown in Figure 6B. The ohmic resistance (R ) of the cell was 0.14, 0.19, and 0.25 Ω cm at
2
o
2
700, 650, and 600 °C, respectively, while the polarization resistance (R ) was 0.07, 0.23, and 0.56 Ω cm ,
p
respectively. At 700 °C, the R was greater than the R , indicating that the cell performance was mainly
o
p
affected by the electrolyte at 700 °C. To further evaluate the stability of a single cell, the measurement was
-2
conducted at 650 °C at a constant current of 0.5 A cm , as shown in Figure 6C. The operating voltage
decreased from 0.83 to 0.80 V during the initial 20 h of the test and remained relatively stable since then.
This might be attributed to the fact that the water generated on the cathode side competes with oxygen for
adsorption. The operating voltage will be stable when the competitive adsorption reaches dynamic
equilibrium . The total degradation rate was about 3.6% after 103 h of stability testing.
[49]
Supplementary Figure 5A and B shows the I-V-P and EIS curves of the cell before and after the stability test.