
Page 141 - Read Online
P. 141
Page 4 of 37 Shipitsyn et al. Energy Mater 2023;3:300038 https://dx.doi.org/10.20517/energymater.2023.22
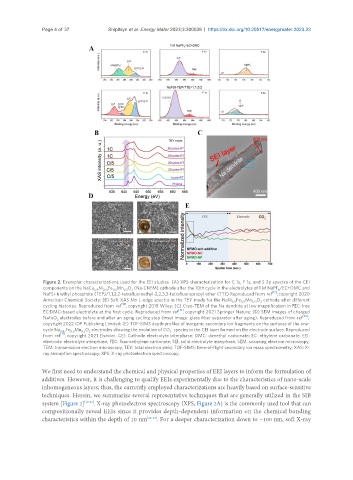
Figure 2. Exemplar characterizations used for the EEI studies. (A) XPS characterization for C 1s, F 1s, and S 2p spectra of the CEI
components on the NaCu Ni Fe Mn O (Na-CNFM) cathode after the 10th cycle in the electrolytes of 1 M NaPF /EC+DMC and
1/9 2/9 1/3 1/3 2 6
[17]
NaFSI-triethyl phosphate (TEP)/1,1,2,2-tetrafluoroethyl-2,2,3,3-tetrafluoropropyl ether (TTE) Reproduced from ref ; copyright 2020
American Chemical Society; (B) Soft XAS Mn L-edge spectra in the TEY mode for the NaNi Fe Mn O cathode after different
1/3 1/3 1/3 2
[18]
cycling histories. Reproduced from ref , copyright 2018 Wiley; (C) Cryo-TEM of the Na dendrite at low magnification in FEC-free
[19]
EC:DMC-based electrolyte at the first cycle. Reproduced from ref , copyright 2021 Springer Nature; (D) SEM images of charged
[20]
NaFeO electrodes before and after an aging cycling step (inset image: glass fiber separator after aging). Reproduced from ref ,
2
copyright 2022 IOP Publishing Limited; (E) TOF-SIMS depth profiles of inorganic secondary ion fragments on the surfaces of the one-
-
cycle Na Fe Mn O electrodes showing the evolution of CO species in the CEI layer formed on the electrode surface. Reproduced
0.67 0.5 0.5 2 3
[21]
from ref , copyright 2021 Elsevier. CEI: Cathode electrolyte interphase; DMC: dimethyl carbonate; EC: ethylene carbonate; EEI:
electrode-electrolyte interphase; FEC: fluoroethylene carbonate; SEI: solid electrolyte interphase; SEM: scanning electron microscopy;
TEM: transmission electron microscopy; TEY: total electron yield; TOF-SIMS: time-of-flight secondary ion mass spectrometry; XAS: X-
ray absorption spectroscopy; XPS: X-ray photoelectron spectroscopy.
We first need to understand the chemical and physical properties of EEI layers to inform the formulation of
additives. However, it is challenging to qualify EEIs experimentally due to the characteristics of nano-scale
inhomogeneous layers; thus, the currently employed characterizations are heavily based on surface-sensitive
techniques. Herein, we summarize several representative techniques that are generally utilized in the SIB
system [Figure 2] [17-21] . X-ray photoelectron spectroscopy (XPS, Figure 2A) is the commonly used tool that can
compositionally reveal EEIs since it provides depth-dependent information on the chemical bonding
characteristics within the depth of 10 nm [22-24] . For a deeper characterization down to ~100 nm, soft X-ray