


Page 81 - 2417
P. 81
Page 12 of 26                                              Salmerón et al. Carbon Footprints 2026, 5, 17


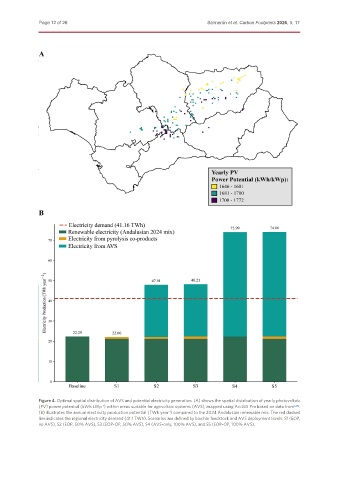
               Figure 4. Optimal spatial distribution of AVS and potential electricity generation. (A) shows the spatial distribution of yearly photovoltaic
               (PV) power potential (kWh kWp ) within areas suitable for agrivoltaic systems (AVS), mapped using ArcGIS Pro based on data from [28] .
                                     -1
               (B) illustrates the annual electricity production potential (TWh year ) compared to the 2024 Andalusian renewable mix. The red dashed
                                                            -1
               line indicates the regional electricity demand (41.1 TWh). Scenarios are defined by biochar feedstock and AVS deployment levels: S1 (EOP,
               no AVS), S2 (EOP, 50% AVS), S3 (EOP-OP, 50% AVS), S4 (AVS-only, 100% AVS), and S5 (EOP-OP, 100% AVS).

