


Page 82 - 2417
P. 82
Salmerón et al. Carbon Footprints 2026, 5, 17                                    Page 13 of 26


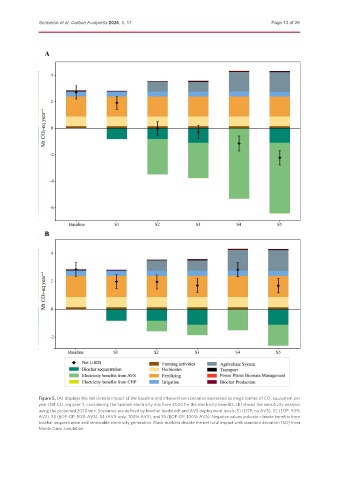
               Figure 5. (A) displays the net climate impact of the baseline and intervention scenarios expressed as mega tonnes of CO 2  equivalent per
               year (Mt CO 2 -eq·year ), considering the Spanish electricity mix from 2024 for the electricity benefits. (B) shows the sensitivity analysis
                             -1
               using the projected 2030 mix. Scenarios are defined by biochar feedstock and AVS deployment levels: S1 (EOP, no AVS), S2 (EOP, 50%
               AVS), S3 (EOP-OP, 50% AVS), S4 (AVS-only, 100% AVS), and S5 (EOP-OP, 100% AVS). Negative values indicate climate benefits from
               biochar sequestration and renewable electricity generation. Black markers denote the net total impact with standard deviation (SD) from
               Monte Carlo simulation.

