


Page 79 - 2417
P. 79
Page 10 of 26                                              Salmerón et al. Carbon Footprints 2026, 5, 17


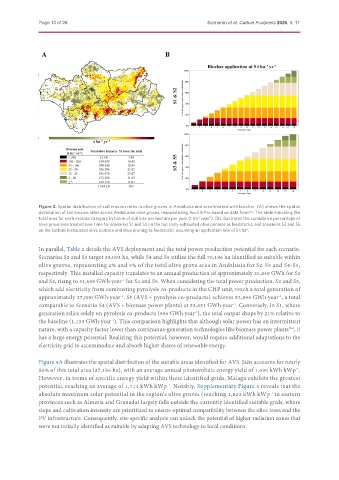
               Figure 3. Spatial distribution of soil erosion rates in olive groves in Andalusia and area treated with biochar. (A) shows the spatial
               distribution of soil erosion rates across Andalusian olive groves, mapped using ArcGIS Pro based on data from . The table indicating the
                                                                                        [13]
               total area for each erosion category in tonne of soil loss per hectare per year (t ha  year ). (B) illustrates the cumulative percentage of
                                                                      -1
                                                                          -1
               olive grove area treated over time for scenarios S1 and S2 on the top (only exhausted olive pomace as feedstock), and scenarios S3 and S5
               on the bottom (exhausted olive pomace and olive pruning as feedstock), assuming an application rate of 5 t·ha .
                                                                                        -1
               In parallel, Table 2 details the AVS deployment and the total power production potential for each scenario.
               Scenarios S2 and S3 target 38,093 ha, while S4 and S5 utilize the full 76,186 ha identified as suitable within
               olive groves, representing 2% and 5% of the total olive grove area in Andalusia for S2-S3 and S4-S5,
               respectively. This installed capacity translates to an annual production of approximately 25,849 GWh for S2
               and S3, rising to 51,698 GWh·year  for S4 and S5. When considering the total power production, S2 and S3,
                                            -1
               which add electricity from combusting pyrolysis co-products in the CHP unit, reach a total generation of
               approximately 27,000 GWh·year . S5 (AVS + pyrolysis co-products) achieves 52,899 GWh·year , a total
                                                                                                   -1
                                           -1
               comparable to Scenario S4 (AVS + biomass power plants) at 52,831 GWh·year . Conversely, in S1, where
                                                                                   -1
               generation relies solely on pyrolysis co-products (896 GWh·year ), the total output drops by 21% relative to
                                                                     -1
               the baseline (1,133 GWh·year ). This comparison highlights that although solar power has an intermittent
                                        -1
               nature, with a capacity factor lower than continuous-generation technologies like biomass power plants , it
                                                                                                      [76]
               has a large energy potential. Realizing this potential, however, would require additional adaptations to the
               electricity grid to accommodate and absorb higher shares of renewable energy.
               Figure 4A illustrates the spatial distribution of the suitable areas identified for AVS. Jaén accounts for nearly
               50% of this total area (37,156 ha), with an average annual photovoltaic energy yield of 1,690 kWh kWp .
                                                                                                         -1
               However, in terms of specific energy yield within these identified grids, Málaga exhibits the greatest
               potential, reaching an average of 1,711 kWh kWp . Notably, Supplementary Figure 5 reveals that the
                                                            -1
               absolute maximum solar potential in the region's olive groves (reaching 1,823 kWh kWp  in eastern
                                                                                                -1
               provinces such as Almería and Granada) largely falls outside the currently identified suitable grids, where
               slope and cultivation intensity are prioritized to ensure optimal compatibility between the olive trees and the
               PV infrastructure. Consequently, site-specific analysis can unlock the potential of higher radiation zones that
               were not initially identified as suitable by adapting AVS technology to local conditions.

