


Page 80 - 2417
P. 80
Salmerón et al. Carbon Footprints 2026, 5, 17                                    Page 11 of 26


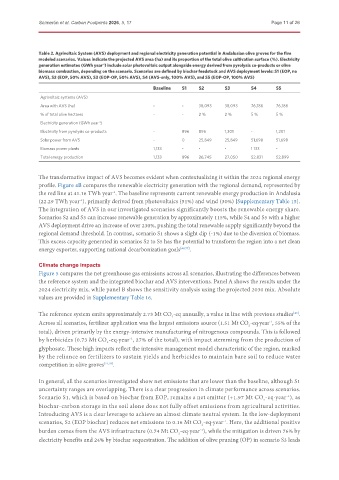
               Table 2. Agrivoltaic System (AVS) deployment and regional electricity generation potential in Andalusian olive groves for the five
               modeled scenarios. Values indicate the projected AVS area (ha) and its proportion of the total olive cultivation surface (%). Electricity
               generation estimates (GWh year ) include solar photovoltaic output alongside energy derived from pyrolysis co-products or olive
                                     -1
               biomass combustion, depending on the scenario. Scenarios are defined by biochar feedstock and AVS deployment levels: S1 (EOP, no
               AVS), S2 (EOP, 50% AVS), S3 (EOP-OP, 50% AVS), S4 (AVS-only, 100% AVS), and S5 (EOP-OP, 100% AVS)
                                                       Baseline  S1    S2       S3       S4       S5
               Agrivoltaic systems (AVS)
               Area with AVS (ha)                      -         -     38,093   38,093   76,186   76,186
               % of total olive hectares               -         -     2 %      2 %      5 %      5 %
               Electricity generation (GWh year )
                                    -1
               Electricity from pyrolysis co-products  -         896   896      1,201    -        1,201
               Solar power from AVS                    -         0     25,849   25,849   51,698   51,698
               Biomass power plants                    1,133     -     -        -        1 133    -
               Total energy production                 1,133     896   26,745   27,050   52,831   52,899


               The transformative impact of AVS becomes evident when contextualizing it within the 2024 regional energy
               profile. Figure 4B compares the renewable electricity generation with the regional demand, represented by
               the red line at 41.16 TWh year . The baseline represents current renewable energy production in Andalusia
                                         -1
               (22.29 TWh year ), primarily derived from photovoltaics (51%) and wind (30%) [Supplementary Table 15].
                             -1
               The integration of AVS in our investigated scenarios significantly boosts the renewable energy share.
               Scenarios S2 and S3 can increase renewable generation by approximately 115%, while S4 and S5 with a higher
               AVS deployment drive an increase of over 230%, pushing the total renewable supply significantly beyond the
               regional demand threshold. In contrast, scenario S1 shows a slight dip (-1%) due to the diversion of biomass.
               This excess capacity generated in scenarios S2 to S5 has the potential to transform the region into a net clean
               energy exporter, supporting national decarbonization goals [49,77] .

               Climate change impacts
               Figure 5 compares the net greenhouse gas emissions across all scenarios, illustrating the differences between
               the reference system and the integrated biochar and AVS interventions. Panel A shows the results under the
               2024 electricity mix, while panel B shows the sensitivity analysis using the projected 2030 mix. Absolute
               values are provided in Supplementary Table 16.


               The reference system emits approximately 2.73 Mt CO -eq annually, a value in line with previous studies .
                                                                                                        [45]
                                                             2
               Across all scenarios, fertilizer application was the largest emissions source (1.51 Mt CO -eq·year , 55% of the
                                                                                                -1
                                                                                        2
               total), driven primarily by the energy-intensive manufacturing of nitrogenous compounds. This is followed
               by herbicides (0.73 Mt CO -eq·year , 27% of the total), with impact stemming from the production of
                                               -1
                                       2
               glyphosate. These high impacts reflect the intensive management model characteristic of the region, marked
               by the reliance on fertilizers to sustain yields and herbicides to maintain bare soil to reduce water
               competition in olive groves [71,78] .
               In general, all the scenarios investigated show net emissions that are lower than the baseline, although S1
               uncertainty ranges are overlapping. There is a clear progression in climate performance across scenarios.
               Scenario S1, which is based on biochar from EOP, remains a net emitter (+1.97 Mt CO -eq·year ), as
                                                                                                      -1
                                                                                              2
               biochar-carbon storage in the soil alone does not fully offset emissions from agricultural activities.
               Introducing AVS is a clear leverage to achieve an almost climate neutral system. In the low-deployment
               scenarios, S2 (EOP biochar) reduces net emissions to 0.16 Mt CO -eq·year . Here, the additional positive
                                                                               -1
                                                                        2
               burden comes from the AVS infrastructure (0.74 Mt CO -eq·year ), while the mitigation is driven 76% by
                                                                       -1
                                                                2
               electricity benefits and 24% by biochar sequestration. The addition of olive pruning (OP) in scenario S3 leads

