


Page 84 - 2417
P. 84
Salmerón et al. Carbon Footprints 2026, 5, 17                                    Page 15 of 26


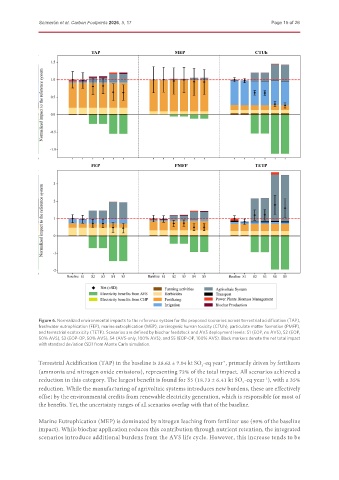
               Figure 6. Normalized environmental impacts to the reference system for the proposed scenarios across terrestrial acidification (TAP),
               freshwater eutrophication (FEP), marine eutrophication (MEP), carcinogenic human toxicity (CTUh), particulate matter formation (PMFP),
               and terrestrial ecotoxicity (TETP). Scenarios are defined by biochar feedstock and AVS deployment levels: S1 (EOP, no AVS), S2 (EOP,
               50% AVS), S3 (EOP-OP, 50% AVS), S4 (AVS-only, 100% AVS), and S5 (EOP-OP, 100% AVS). Black markers denote the net total impact
               with standard deviation (SD) from Monte Carlo simulation.

               Terrestrial Acidification (TAP) in the baseline is 28.62 ± 7.04 kt SO -eq year , primarily driven by fertilizers
                                                                               -1
                                                                        2
               (ammonia and nitrogen oxide emissions), representing 72% of the total impact. All scenarios achieved a
               reduction in this category. The largest benefit is found for S5 (18.73 ± 6.41 kt SO -eq year ), with a 35%
                                                                                              -1
                                                                                      2
               reduction. While the manufacturing of agrivoltaic systems introduces new burdens, these are effectively
               offset by the environmental credits from renewable electricity generation, which is responsible for most of
               the benefits. Yet, the uncertainty ranges of all scenarios overlap with that of the baseline.

               Marine Eutrophication (MEP) is dominated by nitrogen leaching from fertilizer use (90% of the baseline
               impact). While biochar application reduces this contribution through nutrient retention, the integrated
               scenarios introduce additional burdens from the AVS life cycle. However, this increase tends to be

