


Page 78 - 2417
P. 78
Salmerón et al. Carbon Footprints 2026, 5, 17                                     Page 9 of 26


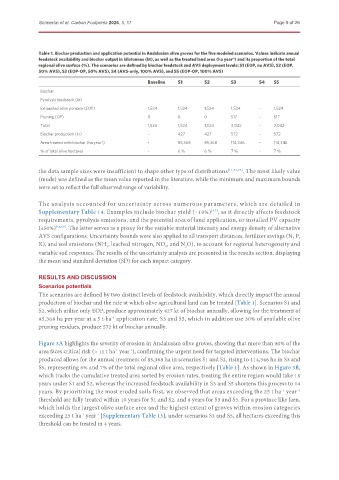
               Table 1. Biochar production and application potential in Andalusian olive groves for the five modeled scenarios. Values indicate annual
               feedstock availability and biochar output in kilotonnes (kt), as well as the treated land area (ha year ) and its proportion of the total
                                                                                   -1
               regional olive surface (%). The scenarios are defined by biochar feedstock and AVS deployment levels: S1 (EOP, no AVS), S2 (EOP,
               50% AVS), S3 (EOP-OP, 50% AVS), S4 (AVS-only, 100% AVS), and S5 (EOP-OP, 100% AVS)
                                                     Baseline  S1        S2       S3        S4   S5
               Biochar
               Pyrolysis feedstock (kt)
               Exhausted olive pomace (EOP)          1,524     1,524     1,524    1,524     -    1,524
               Pruning (OP)                          0         0         0        517       -    517
               Total                                 1,524     1,524     1,524    2,042     -    2,042
               Biochar production (kt)               -         427       427      572       -    572
               Area treated with biochar (ha year )  -         85,368    85,368   114,346   -    114,346
                                     -1
               % of total olive hectares             -         6 %       6 %      7 %       -    7 %

               the data sample sizes were insufficient to shape other type of distributions [11,53,75] . The most likely value
               (mode) was defined as the mean value reported in the literature, while the minimum and maximum bounds
               were set to reflect the full observed range of variability.


               The analysis accounted for uncertainty across numerous parameters, which are detailed in
               Supplementary Table 14. Examples include biochar yield (±18%) , as it directly affects feedstock
                                                                           [47]
               requirements, pyrolysis emissions, and the potential area of land application, or installed PV capacity
               (±50%) [59,60] . The latter serves as a proxy for the variable material intensity and energy density of alternative
               AVS configurations. Uncertainty bounds were also applied to all transport distances, fertilizer savings (N, P,
               K), and soil emissions (NH , leached nitrogen, NO , and N O), to account for regional heterogeneity and
                                                                  2
                                                           x
                                      3
               variable soil responses. The results of the uncertainty analysis are presented in the results section, displaying
               the mean and standard deviation (SD) for each impact category.

               RESULTS AND DISCUSSION
               Scenarios potentials
               The scenarios are defined by two distinct levels of feedstock availability, which directly impact the annual
               production of biochar and the rate at which olive agricultural land can be treated [Table 1]. Scenarios S1 and
               S2, which utilize only EOP, produce approximately 427 kt of biochar annually, allowing for the treatment of
               85,368 ha per year at a 5 t·ha  application rate. S3 and S5, which in addition use 30% of available olive
                                        -1
               pruning residues, produce 572 kt of biochar annually.

               Figure 3A highlights the severity of erosion in Andalusian olive groves, showing that more than 80% of the
               area faces critical risk (> 11 t ha  year ), confirming the urgent need for targeted interventions. The biochar
                                         -1
                                               -1
               produced allows for the annual treatment of 85,368 ha in scenarios S1 and S2, rising to 114,346 ha in S3 and
               S5, representing 6% and 7% of the total regional olive area, respectively [Table 1]. As shown in Figure 3B,
               which tracks the cumulative treated area sorted by erosion rates, treating the entire region would take 18
               years under S1 and S2, whereas the increased feedstock availability in S3 and S5 shortens this process to 14
               years. By prioritizing the most eroded soils first, we observed that areas exceeding the 25 t ha  year -1
                                                                                                    -1
               threshold are fully treated within 10 years for S1 and S2, and 8 years for S3 and S5. For a province like Jaén,
               which holds the largest olive surface area and the highest extent of groves within erosion categories
               exceeding 25 t ha  year  [Supplementary Table 13], under scenarios S3 and S5, all hectares exceeding this
                              -1
                                   -1
               threshold can be treated in 4 years.

