


Page 74 - 2417
P. 74
Salmerón et al. Carbon Footprints 2026, 5, 17                                     Page 5 of 26


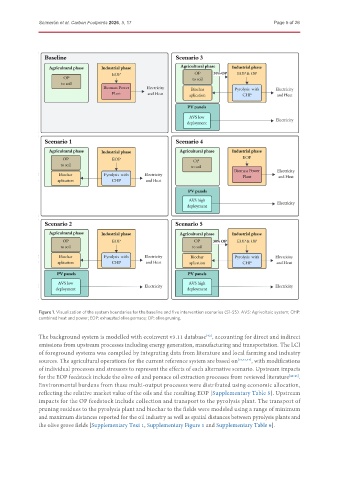
               Figure 1. Visualization of the system boundaries for the baseline and five intervention scenarios (S1-S5). AVS: Agrivoltaic system; CHP:
               combined heat and power; EOP: exhausted olive pomace; OP: olive pruning.


               The background system is modelled with ecoinvent v3.11 database , accounting for direct and indirect
                                                                         [42]
               emissions from upstream processes including energy generation, manufacturing and transportation. The LCI
               of foreground systems was compiled by integrating data from literature and local farming and industry
               sources. The agricultural operations for the current reference system are based on [19,43,44] , with modifications
               of individual processes and stressors to represent the effects of each alternative scenario. Upstream impacts
               for the EOP feedstock include the olive oil and pomace oil extraction processes from reviewed literature [44-46] .
               Environmental burdens from these multi-output processes were distributed using economic allocation,
               reflecting the relative market value of the oils and the resulting EOP [Supplementary Table 5]. Upstream
               impacts for the OP feedstock include collection and transport to the pyrolysis plant. The transport of
               pruning residues to the pyrolysis plant and biochar to the fields were modeled using a range of minimum
               and maximum distances reported for the oil industry as well as spatial distances between pyrolysis plants and
               the olive grove fields [Supplementary Text 1, Supplementary Figure 1 and Supplementary Table 6].

