


Page 106 - 2417
P. 106
Stichnothe et al. Carbon Footprints 2026, 5, 11                                  Page 11 of 17


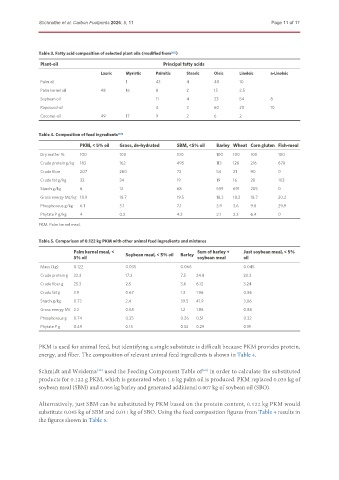
               Table 3. Fatty acid composition of selected plant oils (modified from [65] )
               Plant-oil                                  Principal fatty acids

                                    Lauric   Myristic   Palmitic   Stearic  Oleic    Linoleic   a-Linoleic
               Palm oil                      1          43         4        40       10
               Palm kernel oil      48       16         8          2        15       2.5
               Soybean oil                              11         4        23       54         8
               Rapeseed-oil                             4          2        60       20         10
               Coconut-oil          49       17         9          2        6        2


               Table 4. Composition of feed ingredients [67]
                             PKM, < 5% oil  Grass, de-hydrated  SBM, <5% oil  Barley Wheat Corn gluten Fish-meal
               Dry matter %  100           100                 100           100   100   100       100
               Crude protein g/kg  183     162                 495           113   126   216       678
               Crude fibre   207           260                 72            54    21    90        0
               Crude fat g/kg  32          34                  19            19    16    28        103
               Starch g/kg   6             12                  68            599   691   205       0
               Gross energy MJ/kg 18.9     18.7                19.5          18.3  18.2  18.7      20.2
               Phosphorous g/kg  6.1       3.1                 7.1           3.9   3.6   9.8       29.9
               Phytate P g/kg  4           0.2                 4.3           2.1   2.3   6.4       0

               PKM: Palm kernel meal.

               Table 5. Comparison of 0.122 kg PKM with other animal feed ingredients and mixtures
                           Palm kernel meal, <  Soybean meal, < 5% oil  Barley  Sum of barley +  Just soybean meal, < 5%
                           5% oil                                     soybean meal     oil
               Mass (kg)   0.122             0.035              0.066                  0.045
               Crude protein g  22.3         17.3               7.5   24.8             22.3
               Crude fiber g  25.3           2.5                3.6   6.12             3.24
               Crude fat g  3.9              0.67               1.3   1.96             0.86
               Starch g/kg  0.73             2.4                39.5  41.9             3.06
               Gross energy MJ 2.3           0.68               1.2   1.88             0.88
               Phosphorous g  0.74           0.25               0.26  0.51             0.32
               Phytate P g  0.49             0.15               0.14  0.29             0.19


               PKM is used for animal feed, but identifying a single substitute is difficult because PKM provides protein,
               energy, and fiber. The composition of relevant animal feed ingredients is shown in Table 4.

               Schmidt and Weidema  used the Feeding Component Table of  in order to calculate the substituted
                                                                        [68]
                                   [45]
               products for 0.122 g PKM, which is generated when 1.0 kg palm oil is produced. PKM replaced 0.035 kg of
               soybean meal (SBM) and 0.066 kg barley and generated additional 0.007 kg of soybean oil (SBO).


               Alternatively, just SBM can be substituted by PKM based on the protein content, 0.122 kg PKM would
               substitute 0.045 kg of SBM and 0.011 kg of SBO. Using the feed composition figures from Table 4 results in
               the figures shown in Table 5.

