


Page 103 - 2417
P. 103
Page 8 of 17                                                                                               Stichnothe et al. Carbon Footprints 2026, 5, 11


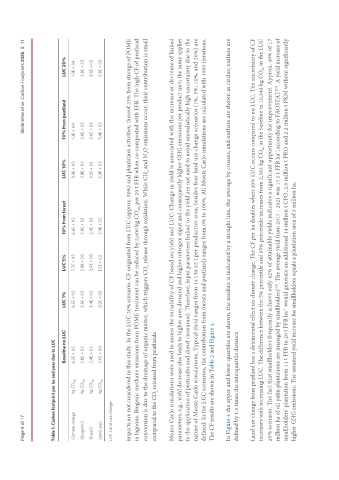
               Table 1. Carbon footprint per ha and year due to LUC
                                          Baseline no LUC    LUC 1%       LUC 5%       10% from forest     LUC 10%      10% from peatland     LUC 20%

               Climate change  kg CO 2eq  6.3E + 03          6.5E + 03    7.7E + 03    6.6E + 03           9.2E + 03    1.2E + 04             1.2E + 04
               (biogenic)      kg CO 2eq  2.8E + 03          2.8E + 03    2.8E + 03    2.8E + 03           2.8E + 03    2.8E + 03             2.8E + 03
               (fossil)        kg CO 2eq  3.4E + 03          3.4E + 03    3.4E + 03    3.4E + 03           3.5E + 03    3.6E + 03             3.6E + 03
               (land use)      kg CO 2eq  3.0E + 00          2.9E + 02    1.5E + 03    3.9E + 02           2.9E + 03    5.4E + 03             5.8E + 03

               LUC: Land-use change.

               impacts are not considered in this study. In the LUC 20% scenario, CF originated from LUC (approx. 50%) and plantation activities, thereof 23% from storage of POME
               in lagoons. Biogenic methane emissions from POME treatment can be reduced by 2,600 kg CO  per 20 t FFB when co-composted with EFB. The high CF of peatland
                                                                                               2eq
               conversion is due to the drainage of organic matter, which triggers CO  release through oxidation. While CH  and N O emissions occur, their contribution is small
                                                                                                                    2
                                                                                                             4
                                                                            2
               compared to the CO  released from peatlands.
                                2
               Monte Carlo simulations were used to assess the variability of CF based on yield and LUC. Change in yield is associated with the increase or decrease of linked
               parameters, e.g., yield decrease also leads to higher area demand and higher nitrogen input and consequently higher GHG emissions per product unit; the same applies
               to the application of pesticides and diesel consumed. Therefore, input parameters linked to the yield are not used to avoid unrealistically high uncertainty due to the
               nature of Monte Carlo simulations. Typical yield ranges from 14 t to 25 t per productive area, besides four land use change scenarios (1%, 5%, 10%, and 20%) are
               defined. In the LUC scenarios, the contribution from forests and peatlands ranges from 0% to 100%. All Monte Carlo simulations are calculated with 1000 iterations.
               The CF results are shown in Table 2 and Figure 4.


               In Figure 4 the upper and lower quartiles are shown, the median is indicated by a straight line, the average by crosses, and outliers are shown as circles; outliers are
               defined by 1.5 times the interquartile distance.

               Land use change from peatland has a detrimental effect on climate change. The CF per ha doubles when 20% LUC occurs compared to no LUC. The uncertainty of CF
               increases with increasing LUC. The difference between the 5% percentile and 95% percentile increases from 2,382 kg CO  in the baseline to 10,248 kg CO  in the LUC
                                                                                                                                                 2e
                                                                                                                     2e
               20% scenario. The fact that smallholders frequently achieve only 42% of attainable yields indicates a significant opportunity for improvement. Approx. 40% of 17
               million ha of oil palm plantations are managed by smallholders . The average yield from 2017 - 2021 was 17.5 t FFB ha ,according to FAOSTAT . A yield increase of
                                                                    [58]
                                                                                                                   -1
                                                                                                                                         [59]
               smallholders’ plantation from 11 t FFB to 20 t FFB ha  would generate an additional 14 million t CPO, 2.0 million t PKO and 2.2 million t PKM without significantly
                                                            -1
               higher GHG emissions. The assumed yield increase for smallholders equals a plantation area of 3 million ha.

