


Page 108 - 2417
P. 108
Stichnothe et al. Carbon Footprints 2026, 5, 11                                  Page 13 of 17


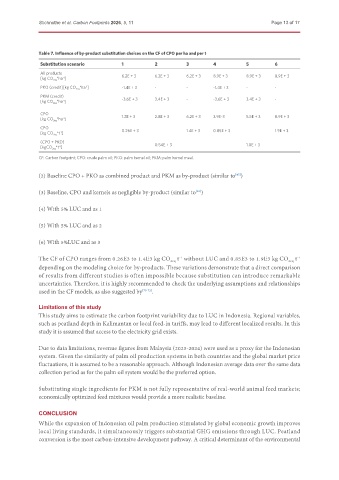
               Table 7. Influence of by-product substitution choices on the CF of CPO per ha and per t
               Substitution scenario        1          2          3         4           5         6

               All products
               [kg CO 2eq *ha ]             6.2E + 3   6.2E + 3   6.2E + 3  8.9E + 3    8.9E + 3  8.9E + 3
                       -1
                               -1
               PKO (credit][kg CO 2eq *ha ]  -1.4E + 3  -         -         -1.4E + 3   -         -
               PKM (credit)
               [kg CO 2eq *ha ]             -3.6E + 3  3.4E + 3   -         -3.6E + 3   3.4E + 3  -
                       -1
               CPO
               [kg CO 2eq *ha ]             1.2E + 3   2.8E + 3   6.2E + 3  3.9E-3      5.5E + 3  8.9E + 3
                       -1
               CPO
               [kg CO 2eq *t ]              0.26E + 3             1.4E + 3  0.85E + 3             1.9E + 3
                      -1
               (CPO + PKO)
               [kgCO 2eq *t ]                          0.54E + 3                        1.0E + 3
                      -1
               CF: Carbon footprint; CPO: crude palm oil; PKO: palm kernel oil; PKM: palm kernel meal.

               (2) Baseline CPO + PKO as combined product and PKM as by-product (similar to )
                                                                                    [45]

               (3) Baseline, CPO and kernels as negligible by-product (similar to )
                                                                      [29]

               (4) With 5% LUC and as 1

               (5) With 5% LUC and as 2


               (6) With 5%LUC and as 3


               The CF of CPO ranges from 0.26E3 to 1.4E3 kg CO  t  without LUC and 0.85E3 to 1.9E3 kg CO  t -1
                                                                -1
                                                             2eq
                                                                                                      2eq
               depending on the modeling choice for by-products. These variations demonstrate that a direct comparison
               of results from different studies is often impossible because substitution can introduce remarkable
               uncertainties. Therefore, it is highly recommended to check the underlying assumptions and relationships
               used in the CF models, as also suggested by [70-72] .


               Limitations of this study
               This study aims to estimate the carbon footprint variability due to LUC in Indonesia. Regional variables,
               such as peatland depth in Kalimantan or local feed-in tariffs, may lead to different localized results. In this
               study it is assumed that access to the electricity grid exists.

               Due to data limitations, revenue figures from Malaysia (2023-2024) were used as a proxy for the Indonesian
               system. Given the similarity of palm oil production systems in both countries and the global market price
               fluctuations, it is assumed to be a reasonable approach. Although Indonesian average data over the same data
               collection period as for the palm oil system would be the preferred option.


               Substituting single ingredients for PKM is not fully representative of real-world animal feed markets;
               economically optimized feed mixtures would provide a more realistic baseline.


               CONCLUSION
               While the expansion of Indonesian oil palm production stimulated by global economic growth improves
               local living standards, it simultaneously triggers substantial GHG emissions through LUC. Peatland
               conversion is the most carbon-intensive development pathway. A critical determinant of the environmental

