


Page 104 - 2417
P. 104
Stichnothe et al. Carbon Footprints 2026, 5, 11                                   Page 9 of 17


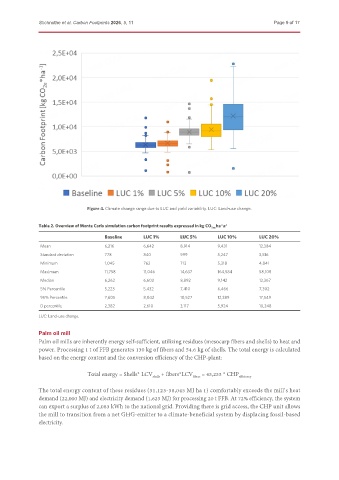
                                Figure 4. Climate change range due to LUC and yield variability. LUC: Land-use change.


               Table 2. Overview of Monte Carlo simulation carbon footprint results expressed in kg CO 2eq  ha a
                                                                               -1  -1
                                      Baseline     LUC 1%       LUC 5%       LUC 10%        LUC 20%
               Mean                   6,216        6,642        8,914        9,431          12,384
               Standard deviation     778          840          999          5,247          3,516
               Minimum                1,045        762          713          5,318          4,841
               Maximum                11,758       11,046       14,637       164,584        58,108
               Median                 6,262        6,602        8,892        9,142          12,367
               5% Percentile          5,223        5,432        7,410        6,466          7,302
               95% Percentile         7,605        8,042        10,527       12,389         17,549
               D percentile           2,382        2,610        3,117        5,924          10,248

               LUC: Land-use change.

               Palm oil mill
               Palm oil mills are inherently energy self-sufficient, utilizing residues (mesocarp fibers and shells) to heat and
               power. Processing 1 t of FFB generates 130 kg of fibers and 54.6 kg of shells. The total energy is calculated
               based on the energy content and the conversion efficiency of the CHP-plant:


                                Total energy = Shells* LCV  + fibers*LCV fibres  = 43,233 * CHP efficiency
                                                       shells
               The total energy content of these residues (31,123-38,045 MJ ha 1) comfortably exceeds the mill’s heat
                                                                        -
               demand (22,000 MJ) and electricity demand (1,623 MJ) for processing 20 t FFB. At 72% efficiency, the system
               can export a surplus of 2,083 kWh to the national grid. Providing there is grid access, the CHP unit allows
               the mill to transition from a net GHG-emitter to a climate-beneficial system by displacing fossil-based
               electricity.

