


Page 107 - 2417
P. 107
Page 12 of 17                                             Stichnothe et al. Carbon Footprints 2026, 5, 11


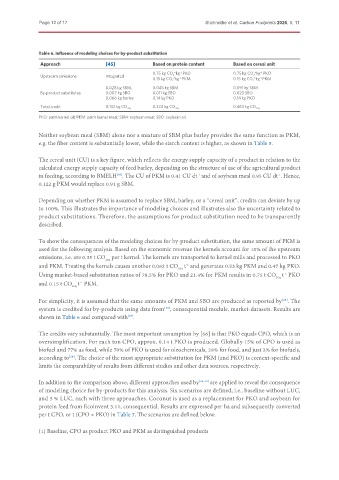
               Table 6. Influence of modeling choices for by-product substitution
               Approach               [45]             Based on protein content    Based on cereal unit

                                                       0.75 kg CO 2 *kg  PKO       0.75 kg CO 2 *kg  PKO
                                                                                             -1
                                                                -1
               Upstream emissions     Integrated
                                                                                            -1
                                                       0.15 kg CO 2 *kg  PKM       0.15 kg CO 2 *kg  PKM
                                                                -1
                                      0.028 kg SBM,    0.045 kg SBM                0.091 kg SBM
               By-product substitutes  0.007 kg SBO    0.011 kg SBO                0.023 SBO
                                      0,066 kg barley  0.14 kg PKO                 0.14 kg PKO
               Total credit           0.132 kg CO 2eq  0.324 kg CO 2eq             0.463 kg CO 2eq
               PKO: palm kernel oil; PKM: palm kernel meal; SBM: soybean meal; SBO: soybean oil.
               Neither soybean meal (SBM) alone nor a mixture of SBM plus barley provides the same function as PKM,
               e.g. the fiber content is substantially lower, while the starch content is higher, as shown in Table 5.


               The cereal unit (CU) is a key figure, which reflects the energy supply capacity of a product in relation to the
               calculated energy supply capacity of feed barley, depending on the structure of use of the agricultural product
               in feeding, according to BMELH . The CU of PKM is 0.41 CU dt  and of soybean meal 0.95 CU dt . Hence,
                                                                                                   -1
                                          [69]
                                                                      -1
               0.122 g PKM would replace 0.91 g SBM.
               Depending on whether PKM is assumed to replace SBM, barley, or a “cereal unit”, credits can deviate by up
               to 100%. This illustrates the importance of modeling choices and illustrates also the uncertainty related to
               product substitutions. Therefore, the assumptions for product substitution need to be transparently
               described.


               To show the consequences of the modeling choices for by-product substitution, the same amount of PKM is
               used for the following analysis. Based on the economic revenue the kernels account for 10% of the upstream
               emissions, i.e. are 0.35 t CO  per t kernel. The kernels are transported to kernel mills and processed to PKO
                                      2eq
               and PKM. Treating the kernels causes another 0.062 t CO  t  and generates 0.53 kg PKM and 0.47 kg PKO.
                                                                  -1
                                                                2eq
               Using market-based substitution ratios of 78.5% for PKO and 21.4% for PKM results in 0.75 t CO  t  PKO
                                                                                                     -1
                                                                                                  2eq
               and 0.15 t CO  t  PKM.
                             -1
                          2eq
               For simplicity, it is assumed that the same amounts of PKM and SBO are produced as reported by . The
                                                                                                    [45]
               system is credited for by-products using data from , consequential module, market-datasets. Results are
                                                           [34]
               shown in Table 6 and compared with .
                                              [45]
               The credits vary substantially. The most important assumption by [66] is that PKO equals CPO, which is an
               oversimplification. For each ton CPO, approx. 0.14 t PKO is produced. Globally 15% of CPO is used as
               biofuel and 77% as food, while 70% of PKO is used for oleochemicals, 28% for food, and just 2% for biofuels,
               according to . The choice of the most appropriate substitution for PKM (and PKO) is context-specific and
                         [64]
               limits the comparability of results from different studies and other data sources, respectively.


               In addition to the comparison above, different approaches used by [28-30]  are applied to reveal the consequence
               of modeling choice for by-products for this analysis. Six scenarios are defined, i.e., baseline without LUC,
               and 5 % LUC, each with three approaches. Coconut is used as a replacement for PKO and soybean for
               protein feed from Ecoinvent 3.11, consequential. Results are expressed per ha and subsequently converted
               per t CPO, or t (CPO + PKO) in Table 7. The scenarios are defined below:

               (1) Baseline, CPO as product PKO and PKM as distinguished products

