


Page 105 - 2417
P. 105
Page 10 of 17                                             Stichnothe et al. Carbon Footprints 2026, 5, 11


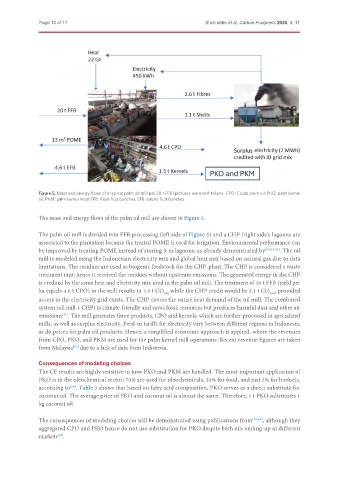
               Figure 5. Mass and energy flows of a typical palm oil mill per 20 t FFB (pictures were self-taken). CPO: Crude palm oil; PKO: palm kernel
               oil; PKM: palm kernel meal; FFB: fresh fruit bunches; EFB: empty fruit bunches.


               The mass and energy flows of the palm oil mill are shown in Figure 5.

               The palm oil mill is divided into FFB processing (left side of Figure 5) and a CHP (right side); lagoons are
               associated to the plantation because the treated POME is used for irrigation. Environmental performance can
               be improved by treating POME instead of storing it in lagoons, as already demonstrated by [32,60-62] . The oil
               mill is modeled using the Indonesian electricity mix and global heat mix based on natural gas due to data
               limitations. The residues are used as biogenic feedstock for the CHP-plant. The CHP is considered a waste
               treatment unit; hence it received the residues without upstream emissions. The generated energy in the CHP
               is credited by the same heat and electricity mix used in the palm oil mill. The treatment of 20 t FFB (yield per
               ha equals 4.6 t CPO) in the mill results in 2.0 t CO  while the CHP credit would be 3.1 t CO , provided
                                                           2eq
                                                                                                2eq
               access to the electricity grid exists. The CHP covers the entire heat demand of the oil mill. The combined
               system (oil mill + CHP) is climate-friendly and saves fossil resources but produces harmful dust and other air
               emissions . The mill generates three products, CPO and kernels, which are further processed in specialized
                       [31]
               mills, as well as surplus electricity. Feed-in tariffs for electricity vary between different regions in Indonesia,
               as do prices for palm oil products. Hence, a simplified economic approach is applied, where the revenues
               from CPO, PKO, and PKM are used for the palm kernel mill operations. Recent revenue figures are taken
               from Malaysia  due to a lack of data from Indonesia.
                           [63]

               Consequences of modeling choices
               The CF results are highly sensitive to how PKO and PKM are handled. The most important application of
               PKO is in the oleochemical sector; 70% are used for oleochemicals, 28% for food, and just 2% for biofuels,
               according to . Table 3 shows that based on fatty acid composition, PKO serves as a direct substitute for
                          [64]
               coconut oil. The average price of PKO and coconut oil is almost the same. Therefore, 1 t PKO substitutes 1
               kg coconut oil.


               The consequences of modeling choices will be demonstrated using publications from [45,66] , although they
               aggregated CPO and PKO hence do not use substitution for PKO despite both oils ending-up in different
               markets .
                     [64]

