


Page 76 - Read online
P. 76
Cui et al. Carbon Footprints 2026, 5, 19                                          Page 9 of 16


               DISCUSSION

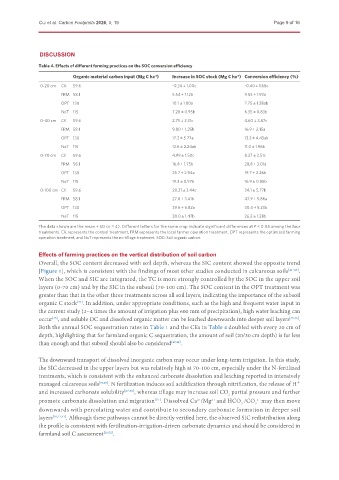
               Table 4. Effects of different farming practices on the SOC conversion efficiency
                           Organic material carbon input (Mg C ha )  Increase in SOC stock (Mg C ha ) Conversion efficiency (%)
                                                                                    -1
                                                       -1
               0-20 cm  CK  59.6                              -0.24 ± 1.00c            -0.40 ± 1.68c
                       FRM 58.1                               5.54 ± 1.12b             9.53 ± 1.93a
                       OPT 130                                10.1 ± 1.80a             7.75 ± 1.38ab
                       NoT 115                                7.28 ± 0.95b             6.35 ± 0.83b
               0-40 cm  CK  59.6                              2.75 ± 2.31c             4.60 ± 3.87c
                       FRM 58.1                               9.80 ± 1.25b             16.9 ± 2.15a
                       OPT 130                                17.2 ± 5.77a             13.2 ± 4.43ab
                       NoT 115                                12.6 ± 2.24ab            11.0 ± 1.96b
               0-70 cm  CK  59.6                              4.99 ± 1.50c             8.37 ± 2.51c
                       FRM 58.1                               16.8 ± 1.75b             28.8 ± 3.01a
                       OPT 130                                25.7 ± 2.94a             19.7 ± 2.26b
                       NoT 115                                19.3 ± 0.97b             16.9 ± 0.85b
               0-100 cm CK  59.6                              20.31 ± 3.44c            34.1 ± 5.77b
                       FRM 58.1                               27.8 ± 3.41b             47.9 ± 5.86a
                       OPT 130                                39.6 ± 6.82a             30.4 ± 5.23b
                       NoT 115                                30.0 ± 1.47b             26.2 ± 1.28b
               The data shown are the mean ± SD (n = 4). Different letters for the same crop indicate significant differences at P < 0.05 among the four
               treatments. CK represents the control treatment, FRM represents the local farmer operation treatment, OPT represents the optimized farming
               operation treatment, and NoT represents the no-tillage treatment. SOC: Soil organic carbon.

               Effects of farming practices on the vertical distribution of soil carbon
               Overall, the SOC content decreased with soil depth, whereas the SIC content showed the opposite trend
               [Figure 1], which is consistent with the findings of most other studies conducted in calcareous soils [41-43] .
               When the SOC and SIC are integrated, the TC is more strongly controlled by the SOC in the upper soil
               layers (0-70 cm) and by the SIC in the subsoil (70-100 cm). The SOC content in the OPT treatment was
               greater than that in the other three treatments across all soil layers, indicating the importance of the subsoil
               organic C stock . In addition, under appropriate conditions, such as the high and frequent water input in
                            [44]
               the current study (2~4 times the amount of irrigation plus 600 mm of precipitation), high water leaching can
               occur , and soluble OC and dissolved organic matter can be leached downwards into deeper soil layers [45,46] .
                   [45]
               Both the annual SOC sequestration rates in Table 1 and the CEs in Table 4 doubled with every 20 cm of
               depth, highlighting that for farmland organic C sequestration, the amount of soil (20/30 cm depth) is far less
               than enough and that subsoil should also be considered [47,48] .


               The downward transport of dissolved inorganic carbon may occur under long-term irrigation. In this study,
               the SIC decreased in the upper layers but was relatively high at 70-100 cm, especially under the N-fertilized
               treatments, which is consistent with the enhanced carbonate dissolution and leaching reported in intensively
               managed calcareous soils [27,49] . N fertilization induces soil acidification through nitrification, the release of H⁺
               and increased carbonate solubility [27,50] , whereas tillage may increase soil CO  partial pressure and further
                                                                                 2
               promote carbonate dissolution and migration . Dissolved Ca /Mg  and HCO /CO  may then move
                                                                           2+
                                                                      2+
                                                       [51]
                                                                                           2-
                                                                                      -
                                                                                           3
                                                                                      3
               downwards with percolating water and contribute to secondary carbonate formation in deeper soil
               layers [10,11,41] . Although these pathways cannot be directly verified here, the observed SIC redistribution along
               the profile is consistent with fertilization-irrigation-driven carbonate dynamics and should be considered in
               farmland soil C assessment [10,52] .

