


Page 72 - Read online
P. 72
Cui et al. Carbon Footprints 2026, 5, 19                                          Page 5 of 16


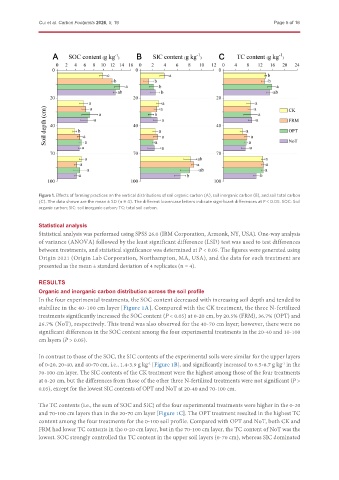
               Figure 1. Effects of farming practices on the vertical distributions of soil organic carbon (A), soil inorganic carbon (B), and soil total carbon
               (C). The data shown are the mean ± SD (n = 4). The different lowercase letters indicate significant differences at P < 0.05. SOC: Soil
               organic carbon; SIC: soil inorganic carbon; TC: total soil carbon.


               Statistical analysis
               Statistical analysis was performed using SPSS 26.0 (IBM Corporation, Armonk, NY, USA). One-way analysis
               of variance (ANOVA) followed by the least significant difference (LSD) test was used to test differences
               between treatments, and statistical significance was determined at P < 0.05. The figures were generated using
               Origin 2021 (Origin Lab Corporation, Northampton, MA, USA), and the data for each treatment are
               presented as the mean ± standard deviation of 4 replicates (n = 4).


               RESULTS
               Organic and inorganic carbon distribution across the soil profile
               In the four experimental treatments, the SOC content decreased with increasing soil depth and tended to
               stabilize in the 40-100 cm layer [Figure 1A]. Compared with the CK treatment, the three N-fertilized
               treatments significantly increased the SOC content (P < 0.05) at 0-20 cm, by 20.5% (FRM), 36.7% (OPT) and
               26.7% (NoT), respectively. This trend was also observed for the 40-70 cm layer; however, there were no
               significant differences in the SOC content among the four experimental treatments in the 20-40 and 10-100
               cm layers (P > 0.05).


               In contrast to those of the SOC, the SIC contents of the experimental soils were similar for the upper layers
               of 0-20, 20-40, and 40-70 cm, i.e., 1.4-3.9 g kg  [Figure 1B], and significantly increased to 6.5-8.7 g kg  in the
                                                     -1
                                                                                                    -1
               70-100 cm layer. The SIC contents of the CK treatment were the highest among those of the four treatments
               at 0-20 cm, but the differences from those of the other three N-fertilized treatments were not significant (P >
               0.05), except for the lowest SIC contents of OPT and NoT at 20-40 and 70-100 cm.


               The TC contents (i.e., the sum of SOC and SIC) of the four experimental treatments were higher in the 0-20
               and 70-100 cm layers than in the 20-70 cm layer [Figure 1C]. The OPT treatment resulted in the highest TC
               content among the four treatments for the 0-100 soil profile. Compared with OPT and NoT, both CK and
               FRM had lower TC contents in the 0-20 cm layer, but in the 70-100 cm layer, the TC content of NoT was the
               lowest. SOC strongly controlled the TC content in the upper soil layers (0-70 cm), whereas SIC dominated

