


Page 73 - Read online
P. 73
Page 6 of 16                                                   Cui et al. Carbon Footprints 2026, 5, 19


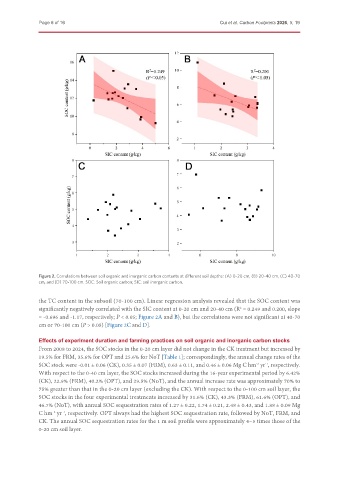
               Figure 2. Correlations between soil organic and inorganic carbon contents at different soil depths: (A) 0-20 cm, (B) 20-40 cm, (C) 40-70
               cm, and (D) 70-100 cm. SOC: Soil organic carbon; SIC: soil inorganic carbon.


               the TC content in the subsoil (70-100 cm). Linear regression analysis revealed that the SOC content was
               significantly negatively correlated with the SIC content at 0-20 cm and 20-40 cm (R  = 0.249 and 0.200, slope
                                                                                     2
               = -0.696 and -1.17, respectively; P < 0.05; Figure 2A and B), but the correlations were not significant at 40-70
               cm or 70-100 cm (P > 0.05) [Figure 2C and D].


               Effects of experiment duration and farming practices on soil organic and inorganic carbon stocks
               From 2008 to 2024, the SOC stocks in the 0-20 cm layer did not change in the CK treatment but increased by
               19.5% for FRM, 35.6% for OPT and 25.6% for NoT [Table 1]; correspondingly, the annual change rates of the
               SOC stock were -0.01 ± 0.06 (CK), 0.35 ± 0.07 (FRM), 0.63 ± 0.11, and 0.46 ± 0.06 Mg C hm  yr , respectively.
                                                                                           -2
                                                                                              -1
               With respect to the 0-40 cm layer, the SOC stocks increased during the 16-year experimental period by 6.42%
               (CK), 22.9% (FRM), 40.2% (OPT), and 29.5% (NoT), and the annual increase rate was approximately 70% to
               75% greater than that in the 0-20 cm layer (excluding the CK). With respect to the 0-100 cm soil layer, the
               SOC stocks in the four experimental treatments increased by 31.6% (CK), 43.3% (FRM), 61.6% (OPT), and
               46.7% (NoT), with annual SOC sequestration rates of 1.27 ± 0.22, 1.74 ± 0.21, 2.48 ± 0.43, and 1.88 ± 0.09 Mg
               C hm  yr , respectively. OPT always had the highest SOC sequestration rate, followed by NoT, FRM, and
                       -1
                   -2
               CK. The annual SOC sequestration rates for the 1 m soil profile were approximately 4~5 times those of the
               0-20 cm soil layer.

