


Page 71 - Read online
P. 71
Page 4 of 16                                                   Cui et al. Carbon Footprints 2026, 5, 19


               (4) No-tillage treatment (NoT): From 2008 to 2024, an Soil Testing and Fertilizer Formulation (STFF)
               fertilization program similar to OPT was adopted, resulting in average N inputs from mineral fertilizer of 155
               kg N ha  in the wheat season and 175 kg N ha  in the maize season. Tillage was not performed. P and K
                                                       -1
                      -1
               fertilization was also similar to OPT. Straw return and irrigation were similar to those in the CK treatment.

               Measurement and calculation
               Sampling and analysis
               Before the wheat sowing in 2008, soil samples were collected, and the bulk density was measured in the 0-20,
               20-40, 40-60, 60-80, and 80-100 cm soil layers . After the 2024 wheat harvest, soil samples were collected
                                                      [35]
               from the 0-20, 20-40, 40-70, and 70-100 cm layers. Soil bulk density was also determined during soil
               sampling. Total soil carbon (TC) was measured using an elemental analyser (Flash EA1112). The SOC
               content was determined using the wet oxidation method , and the SIC content was calculated as the
                                                                  [36]
               difference between TC and SOC.

               Calculation of carbon stock, annual change rate and carbon conversion efficiency
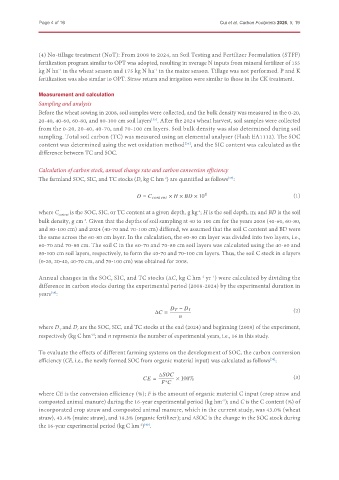
               The farmland SOC, SIC, and TC stocks (D, kg C hm ) are quantified as follows :
                                                                                 [37]
                                                           -2
                                                    =                   ×    ×      × 10 4              (1)

               where C content  is the SOC, SIC, or TC content at a given depth, g kg ; H is the soil depth, m; and BD is the soil
                                                                      -1
               bulk density, g cm . Given that the depths of soil sampling at 40 to 100 cm for the years 2008 (40-60, 60-80,
                              -3
               and 80-100 cm) and 2024 (40-70 and 70-100 cm) differed, we assumed that the soil C content and BD were
               the same across the 60-80 cm layer. In the calculation, the 60-80 cm layer was divided into two layers, i.e.,
               60-70 and 70-80 cm. The soil C in the 60-70 and 70-80 cm soil layers was calculated using the 40-60 and
               80-100 cm soil layers, respectively, to form the 40-70 and 70-100 cm layers. Thus, the soil C stock in 4 layers
               (0-20, 20-40, 40-70 cm, and 70-100 cm) was obtained for 2008.


               Annual changes in the SOC, SIC, and TC stocks (ΔC, kg C hm  yr ) were calculated by dividing the
                                                                        -2
                                                                           -1
               difference in carbon stocks during the experimental period (2008-2024) by the experimental duration in
               years :
                   [38]

                                                                   −                                    (2)
                                                       Δ   =

               where D  and D  are the SOC, SIC, and TC stocks at the end (2024) and beginning (2008) of the experiment,
                      T
                            I
               respectively (kg C hm ; and n represents the number of experimental years, i.e., 16 in this study.
                                 -2)
               To evaluate the effects of different farming systems on the development of SOC, the carbon conversion
               efficiency (CE, i.e., the newly formed SOC from organic material input) was calculated as follows :
                                                                                                [39]

                                                         △                                              (3)
                                                        =      × 100%
                                                           ∗

               where CE is the conversion efficiency (%); F is the amount of organic material C input (crop straw and
               composted animal manure) during the 16-year experimental period (kg hm ); and C is the C content (%) of
                                                                               -2
               incorporated crop straw and composted animal manure, which in the current study, was 43.0% (wheat
               straw), 43.4% (maize straw), and 18.3% (organic fertilizer); and ΔSOC is the change in the SOC stock during
               the 16-year experimental period (kg C hm ) .
                                                  -2 [40]

