


Page 74 - Read online
P. 74
Cui et al. Carbon Footprints 2026, 5, 19                                          Page 7 of 16


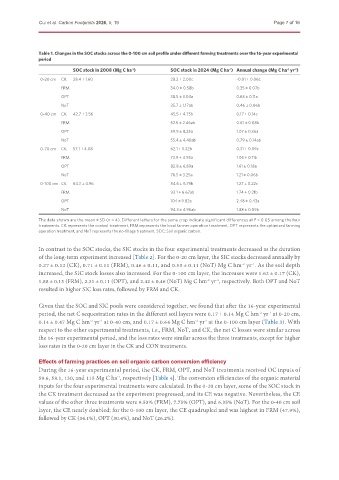
               Table 1. Changes in the SOC stocks across the 0-100 cm soil profile under different farming treatments over the 16-year experimental
               period

                           SOC stock in 2008 (Mg C ha )      SOC stock in 2024 (Mg C ha ) Annual change (Mg C ha  yr )
                                                                                                      -1
                                                                                                        -1
                                                                                 -1
                                               -1
               0-20 cm  CK  28.4 ± 1.60                      28.2 ± 2.00c           -0.01 ± 0.06c
                       FRM                                   34.0 ± 0.58b           0.35 ± 0.07b
                       OPT                                   38.5 ± 3.04a           0.63 ± 0.11a
                       NoT                                   35.7 ± 1.17ab          0.46 ± 0.06b
               0-40 cm  CK  42.7 ± 3.56                      45.5 ± 4.75b           0.17 ± 0.14c
                       FRM                                   52.5 ± 2.46ab          0.61 ± 0.08b
                       OPT                                   59.9 ± 8.25a           1.07 ± 0.36a
                       NoT                                   55.4 ± 4.40ab          0.79 ± 0.14ab
               0-70 cm  CK  57.1 ± 4.08                      62.1 ± 5.32b           0.31 ± 0.09c
                       FRM                                   73.9 ± 4.95a           1.05 ± 0.11b
                       OPT                                   82.8 ± 6.89a           1.61 ± 0.18a
                       NoT                                   76.5 ± 3.25a           1.21 ± 0.06b
               0-100 cm CK  64.3 ± 4.96                      84.6 ± 6.75b           1.27 ± 0.22c
                       FRM                                   92.1 ± 6.67ab          1.74 ± 0.21b
                       OPT                                   104 ± 9.82a            2.48 ± 0.43a
                       NoT                                   94.3 ± 4.96ab          1.88 ± 0.09b

               The data shown are the mean ± SD (n = 4). Different letters for the same crop indicate significant differences at P < 0.05 among the four
               treatments. CK represents the control treatment, FRM represents the local farmer operation treatment, OPT represents the optimized farming
               operation treatment, and NoT represents the no-tillage treatment. SOC: Soil organic carbon.


               In contrast to the SOC stocks, the SIC stocks in the four experimental treatments decreased as the duration
               of the long-term experiment increased [Table 2]. For the 0-20 cm layer, the SIC stocks decreased annually by
               0.27 ± 0.12 (CK), 0.71 ± 0.11 (FRM), 0.46 ± 0.11, and 0.53 ± 0.11 (NoT) Mg C hm  yr . As the soil depth
                                                                                      -2
                                                                                         -1
               increased, the SIC stock losses also increased. For the 0-100 cm layer, the increases were 1.62 ± 0.17 (CK),
               1.88 ± 0.13 (FRM), 2.31 ± 0.11 (OPT), and 2.42 ± 0.46 (NoT) Mg C hm  yr , respectively. Both OPT and NoT
                                                                          -2
                                                                             -1
               resulted in higher SIC loss rates, followed by FRM and CK.
               Given that the SOC and SIC pools were considered together, we found that after the 16-year experimental
               period, the net C sequestration rates in the different soil layers were 0.17 ± 0.14 Mg C hm  yr  at 0-20 cm,
                                                                                            -2
                                                                                               -1
               0.14 ± 0.47 Mg C hm  yr  at 0-40 cm, and 0.17 ± 0.64 Mg C hm  yr at the 0-100 cm layer (Table 3). With
                                    -1
                                 -2
                                                                         -1
                                                                      -2
               respect to the other experimental treatments, i.e., FRM, NoT, and CK, the net C losses were similar across
               the 16-year experimental period, and the loss rates were similar across the three treatments, except for higher
               loss rates in the 0-20 cm layer in the CK and CON treatments.
               Effects of farming practices on soil organic carbon conversion efficiency
               During the 16-year experimental period, the CK, FRM, OPT, and NoT treatments received OC inputs of
               59.6, 58.1, 130, and 115 Mg C ha , respectively [Table 4]. The conversion efficiencies of the organic material
                                          -1
               inputs for the four experimental treatments were calculated. In the 0-20 cm layer, some of the SOC stock in
               the CK treatment decreased as the experiment progressed, and its CE was negative. Nevertheless, the CE
               values of the other three treatments were 9.53% (FRM), 7.75% (OPT), and 6.35% (NoT). For the 0-40 cm soil
               layer, the CE nearly doubled; for the 0-100 cm layer, the CE quadrupled and was highest in FRM (47.9%),
               followed by CK (34.1%), OPT (30.4%), and NoT (26.2%).

