


Page 75 - Read online
P. 75
Page 8 of 16                                                   Cui et al. Carbon Footprints 2026, 5, 19


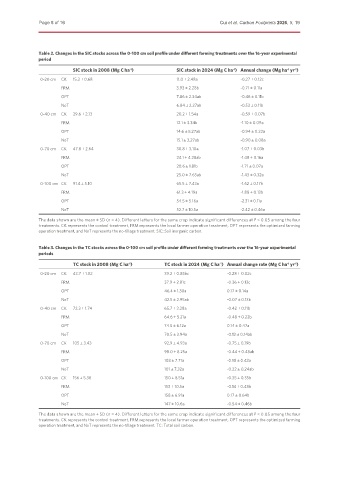
               Table 2. Changes in the SIC stocks across the 0-100 cm soil profile under different farming treatments over the 16-year experimental
               period

                           SIC stock in 2008 (Mg C ha )        SIC stock in 2024 (Mg C ha ) Annual change (Mg ha  yr )
                                               -1
                                                                                                        -1
                                                                                                      -1
                                                                                   -1
               0-20 cm  CK  15.3 ± 0.68                        11.0 ± 2.48a          -0.27 ± 0.12c
                       FRM                                     3.93 ± 2.28b          -0.71 ± 0.11a
                       OPT                                     7.86 ± 2.34ab         -0.46 ± 0.11b
                       NoT                                     6.84 ± 2.27ab         -0.53 ± 0.11b
               0-40 cm  CK  29.6 ± 2.13                        20.2 ± 1.54a          -0.59 ± 0.07b
                       FRM                                     12.1 ± 3.34b          -1.10 ± 0.09a
                       OPT                                     14.6 ± 5.27ab         -0.94 ± 0.22a
                       NoT                                     15.1 ± 3.27ab         -0.90 ± 0.08a
               0-70 cm  CK  47.8 ± 2.64                        30.8 ± 3.10a          -1.07 ± 0.03b
                       FRM                                     24.1 ± 4.28ab         -1.48 ± 0.16a
                       OPT                                     20.6 ± 1.81b          -1.71 ± 0.07a
                       NoT                                     25.0 ± 7.63ab         -1.43 ± 0.32a
               0-100 cm CK  91.4 ± 5.10                        65.5 ± 7.43a          -1.62 ± 0.17b
                       FRM                                     61.3 ± 4.19a          -1.88 ± 0.13b
                       OPT                                     54.5 ± 5.16a          -2.31 ± 0.11a
                       NoT                                     52.7 ± 10.5a          -2.42 ± 0.46a

               The data shown are the mean ± SD (n = 4). Different letters for the same crop indicate significant differences at P < 0.05 among the four
               treatments. CK represents the control treatment, FRM represents the local farmer operation treatment, OPT represents the optimized farming
               operation treatment, and NoT represents the no-tillage treatment. SIC: Soil inorganic carbon.


               Table 3. Changes in the TC stocks across the 0-100 cm soil profile under different farming treatments over the 16-year experimental
               periods
                           TC stock in 2008 (Mg C ha )     TC stock in 2024 (Mg C ha ) Annual change rate (Mg C ha  yr )
                                              -1
                                                                              -1
                                                                                                      -1
                                                                                                        -1
               0-20 cm  CK  43.7 ± 1.02                    39.2 ± 0.85bc         -0.28 ± 0.02c
                       FRM                                 37.9 ± 2.81c          -0.36 ± 0.13c
                       OPT                                 46.4 ± 1.30a          0.17 ± 0.14a
                       NoT                                 42.5 ± 2.95ab         -0.07 ± 0.13b
               0-40 cm  CK  72.3 ± 1.74                    65.7 ± 3.28a          -0.42 ± 0.11b
                       FRM                                 64.6 ± 5.21a          -0.48 ± 0.22b
                       OPT                                 74.5 ± 6.12a          0.14 ± 0.47a
                       NoT                                 70.5 ± 3.94a          -0.12 ± 0.14ab
               0-70 cm  CK  105 ± 3.43                     92.9 ± 4.93a          -0.75 ± 0.19b
                       FRM                                 98.0 ± 8.25a          -0.44 ± 0.48ab
                       OPT                                 103 ± 7.71a           -0.10 ± 0.43a
                       NoT                                 101 ± 7.32a           -0.22 ± 0.24ab
               0-100 cm CK  156 ± 5.36                     150 ± 8.51a           -0.35 ± 0.35b
                       FRM                                 153 ± 10.5a           -0.14 ± 0.48b
                       OPT                                 158 ± 6.91a           0.17 ± 0.64b
                       NoT                                 147 ± 10.6a           -0.54 ± 0.46b
               The data shown are the mean ± SD (n = 4). Different letters for the same crop indicate significant differences at P < 0.05 among the four
               treatments. CK represents the control treatment, FRM represents the local farmer operation treatment, OPT represents the optimized farming
               operation treatment, and NoT represents the no-tillage treatment. TC: Total soil carbon.

