


Page 79 - Read online
P. 79
Page 12 of 16                                                  Cui et al. Carbon Footprints 2026, 5, 19


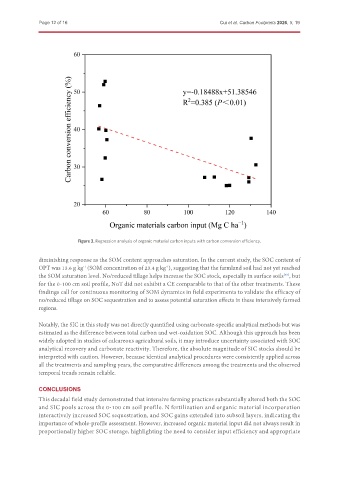
                            Figure 3. Regression analysis of organic material carbon inputs with carbon conversion efficiency.


               diminishing response as the SOM content approaches saturation. In the current study, the SOC content of
               OPT was 13.6 g kg  (SOM concentration of 23.4 g kg ), suggesting that the farmland soil had not yet reached
                                                           -1
                              -1
               the SOM saturation level. No/reduced tillage helps increase the SOC stock, especially in surface soils , but
                                                                                                     [64]
               for the 0-100 cm soil profile, NoT did not exhibit a CE comparable to that of the other treatments. These
               findings call for continuous monitoring of SOM dynamics in field experiments to validate the efficacy of
               no/reduced tillage on SOC sequestration and to assess potential saturation effects in these intensively farmed
               regions.


               Notably, the SIC in this study was not directly quantified using carbonate-specific analytical methods but was
               estimated as the difference between total carbon and wet-oxidation SOC. Although this approach has been
               widely adopted in studies of calcareous agricultural soils, it may introduce uncertainty associated with SOC
               analytical recovery and carbonate reactivity. Therefore, the absolute magnitude of SIC stocks should be
               interpreted with caution. However, because identical analytical procedures were consistently applied across
               all the treatments and sampling years, the comparative differences among the treatments and the observed
               temporal trends remain reliable.

               CONCLUSIONS
               This decadal field study demonstrated that intensive farming practices substantially altered both the SOC
               and SIC pools across the 0-100 cm soil profile. N fertilization and organic material incorporation
               interactively increased SOC sequestration, and SOC gains extended into subsoil layers, indicating the
               importance of whole-profile assessment. However, increased organic material input did not always result in
               proportionally higher SOC storage, highlighting the need to consider input efficiency and appropriate

