


Page 36 - Read Online
P. 36
Özbek et al. Carbon Footprints 2025, 4, 30  https://dx.doi.org/10.20517/cf.2025.43  Page 15 of 21

               Table 6. Model-1 FMOLS and CCR (robustness) results
                                                           FMOLS (dependent variable:EF)
                Variables
                                   Coeff.          Std. error         t-statistic         P-value
                GDP                2.11 ***        0.54               3.89                0.00
                                       ***
                GDP2               -0.14           0.04               -3.91               0.00
                NREN               1.08 ***        0.15               7.30                0.00
                                       *
                TO                 -0.05           0.03               -1.75               0.09
                                       ***
                C                  -10.34          1.98               -5.21               0.00
                                       ***
                T                  -0.02           0.00               -5.12               0.00
                Variables          CCR (robustness)
                                   Coeff.          Std. error         t-statistic         P-value
                GDP                2.17 ***        0.64               3.40                0.00
                                       ***
                GDP2               -0.14           0.04               -3.37               0.00
                NREN               1.09 ***        0.15               7.26                0.00
                TO                 -0.05           0.03               -1.54               0.13
                                       ***
                C                  -10.61          2.32               -4.58               0.00
                                       ***
                T                  -0.02           0.00               -5.41               0.00
               C denotes the constant term, and T denotes the train term. Adjusted R-squared values are 0.98 and 0.98 for the FMOLS and CCR estimations,
               respectively. 10%, 5% and 1% significance levels are highlighted with *, and ***, respectively.


               Table 7. Model-2 FMOLS and CCR (robustness) results
                                                          FMOLS (dependent variable:REN)
                Variables
                                  Coeff.         Std. ERROR             t-statistic        P-value
                                      ***
                GDP               -14.15         2.66                   -5.31              0.00
                                     ***
                GDP2              1.02           0.20                   5.13               0.00
                TO                0.46 ***       0.13                   3.46               0.00
                URB               3.42           2.05                   1.67               0.11
                C                 36.01 ***      11.85                  3.04               0.00
                                      *
                T                 -0.12          0.07                   -1.72              0.09
                Variables         CCR (robustness)
                                  Coeff.         Std. error             t-statistic        P-value
                                      ***
                GDP               -14.67         3.04                   -4.83              0.00
                                     ***
                GDP2              1.05           0.23                   4.66               0.00
                TO                0.48 ***       0.14                   3.29               0.00
                URB               3.48           2.29                   1.52               0.14
                C                 37.63 ***      13.35                  2.82               0.00
                                      *
                T                 -0.13          0.074                  -1.83              0.08
               C denotes the constant term, and T denotes the train term. Adjusted R-squared values are 0.972937 and 0.972505 for the FMOLS and CCR
               estimations, respectively. 10%, 5% and 1% significance levels are highlighted with *, and ***, respectively.

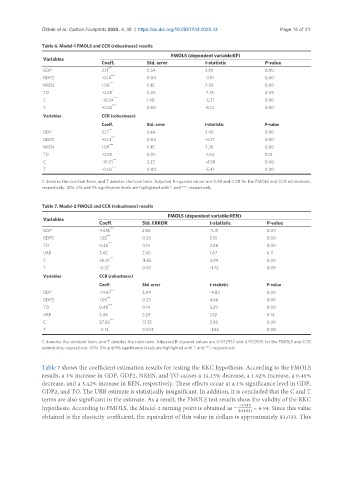
               Table 7 shows the coefficient estimation results for testing the RKC hypothesis. According to the FMOLS
               results, a 1% increase in GDP, GDP2, NREN, and TO causes a 14.15% decrease, a 1.02% increase, a 0.46%
               decrease, and a 3.42% increase in REN, respectively. These effects occur at a 1% significance level in GDP,
               GDP2, and TO. The URB estimate is statistically insignificant. In addition, it is concluded that the C and T
               terms are also significant in the estimate. As a result, the FMOLS test results show the validity of the RKC
               hypothesis. According to FMOLS, the Model-2 turning point is obtained as    = 6.94. Since this value
               obtained is the elasticity coefficient, the equivalent of this value in dollars is approximately $1,033. This

