


Page 33 - Read Online
P. 33
Page 12 of 21                   Özbek et al. Carbon Footprints 2025, 4, 30  https://dx.doi.org/10.20517/cf.2025.43

               Table 3. Fourier ADF test findings
                                                                                     Crit. val. (10%; 5%; 1%)
                Model with a constant             Freq.  FADF stat.  F(k)  Min. RSS
                                                                                   FADF test     F test
                EF                                1     -2.00 (0)  42.89  0.21     -3.52;        4.13;
                                                                                   -3.85;        4.93;
                REN                               1     -0.92 (0)  29.11  2.91
                                                                                   -4.43         6.73
                GDP                               1     -0.67 (1)  28.46  2.16
                GDP2                              1     -0.60 (1)  28.45  418.42
                NREN                              1     -1.19 (0)  32.00  1.03
                TO                                1     -1.40 (0)  52.30  1.09
                URB                               1     0.19 (1)   25.03  0.13
                Model with a constant and a linear trend  Freq.  FADF stat.  F(k)  Min. RSS  Crit. val. (10%; 5%; 1%)
                                                                                   FADF test     F test
                                                   x
                EF                                2     -3.79 (0)  14.59  0.030    -4.15;        4.16;
                                                                                   -4.46;        4.97;
                REN                               1     -3.23 (0)  20.79  0.27
                                                                                   -5.11         6.87
                GDP                               1     -3.88 (0)  18.73  0.02
                GDP2                              1     -4.26 (1)  29.62  3.84
                NREN                              1     -3.19 (0)  16.65  0.02
                TO                                1     -2.64 (0)  54.38  0.27
                URB                               1     -0.38 (0)  125.77  0.00

                                                      x
               The values in parentheses display the appropriate lag length.  : when the frequency is 2, the critical values or the FADF in the fixed and trended
               model are 10%, 5%; -3.79; -4.16, -4.83 at 1%, respectively. The critical values or the fixed and trended model were obtained from the study of
                    [70]                                                        [58]
               Hepsağ  . The critical values for the case of k = 1 were obtained by Christopoulos and León-Ledesma   and are given in Table 2. The critical
               values for F(k) were taken from the study of Becker et al. [60] .
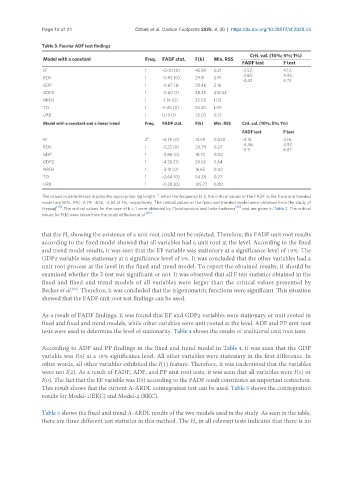
               that the H  showing the existence of a unit root could not be rejected. Therefore, the FADF unit root results
                        0
               according to the fixed model showed that all variables had a unit root at the level. According to the fixed
               and trend model results, it was seen that the EF variable was stationary at a significance level of 10%. The
               GDP2 variable was stationary at a significance level of 5%. It was concluded that the other variables had a
               unit root process at the level in the fixed and trend model. To report the obtained results, it should be
               examined whether the F test was significant or not. It was observed that all F test statistics obtained in the
               fixed and fixed and trend models of all variables were larger than the critical values presented by
               Becker et al. . Therefore, it was concluded that the trigonometric functions were significant. This situation
                         [60]
               showed that the FADF unit root test findings can be used.


               As a result of FADF findings, it was found that EF and GDP2 variables were stationary or unit rooted in
               fixed and fixed and trend models, while other variables were unit rooted at the level. ADF and PP unit root
               tests were used to determine the level of stationarity. Table 4 shows the results of traditional unit root tests.

               According to ADF and PP findings in the fixed and trend model in Table 4, it was seen that the GDP
               variable was I(0) at a 10% significance level. All other variables were stationary in the first difference. In
               other words, all other variables exhibited the I(1) feature. Therefore, it was understood that the variables
               were not I(2). As a result of FADF, ADF, and PP unit root tests, it was seen that all variables were I(1) or
               I(0). The fact that the EF variable was I(0) according to the FADF result constitutes an important restriction.
               This result shows that the current A-ARDL cointegration test can be used. Table 5 shows the cointegration
               results for Model-1(EKC) and Model-2 (RKC).


               Table 5 shows the fixed and trend A-ARDL results of the two models used in the study. As seen in the table,
               there are three different test statistics in this method. The H  in all relevant tests indicates that there is no
                                                                   0

