


Page 35 - Read Online
P. 35
Page 14 of 21                   Özbek et al. Carbon Footprints 2025, 4, 30  https://dx.doi.org/10.20517/cf.2025.43

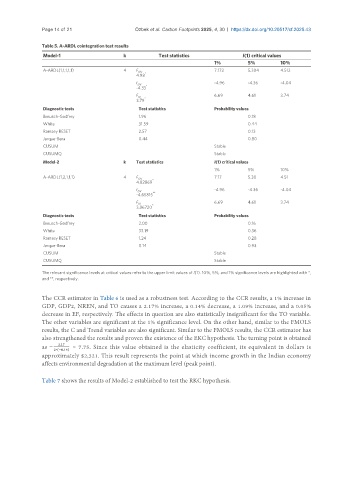
               Table 5. A-ARDL cointegration test results
                Model-1                    k           Test statistics             I(1) critical values
                                                                         1%          5%         10%
                A-ARDL(1,1,1,1,1)          4   F                         7.172       5.304      4.512
                                                OV
                                               4.98 *
                                               t                         -4.96       -4.36      -4.04
                                               DV
                                               -4.33 *
                                               F                         6.69        4.61       3.74
                                                IV
                                               3.79 *
                Diagnostic tests                Test statistics          Probability values
                Breusch-Godfrey                 1.96                                 0.18
                White                           31.59                                0.44
                Ramsey RESET                    2.57                                 0.13
                Jarque-Bera                     0.44                                 0.80
                CUSUM                                                    Stable
                CUSUMQ                                                   Stable
                Model-2                    k   Test statistics           I(1) critical values
                                                                         1%          5%         10%
                A-ARDL(1,2,1,1,1)          4   F                         7.17        5.30       4.51
                                                OV
                                               4.82869 *
                                               t                         -4.96       -4.36      -4.04
                                               DV
                                               -4.65815 **
                                               F                         6.69        4.61       3.74
                                                IV
                                               3.86720 *
                Diagnostic tests                Test statistics          Probability values
                Breusch-Godfrey                 2.00                                 0.16
                White                           33.19                                0.36
                Ramsey RESET                    1.24                                 0.28
                Jarque-Bera                     0.14                                 0.93
                CUSUM                                                    Stable
                CUSUMQ                                                   Stable

               The relevant significance levels at critical values refer to the upper limit values of I(1). 10%, 5%, and 1% significance levels are highlighted with *,
               and **, respectively.


               The CCR estimator in Table 6 is used as a robustness test. According to the CCR results, a 1% increase in
               GDP, GDP2, NREN, and TO causes a 2.17% increase, a 0.14% decrease, a 1.09% increase, and a 0.05%
               decrease in EF, respectively. The effects in question are also statistically insignificant for the TO variable.
               The other variables are significant at the 1% significance level. On the other hand, similar to the FMOLS
               results, the C and Trend variables are also significant. Similar to the FMOLS results, the CCR estimator has
               also strengthened the results and proven the existence of the EKC hypothesis. The turning point is obtained
               as         = 7.75. Since this value obtained is the elasticity coefficient, its equivalent in dollars is
               approximately $2,321. This result represents the point at which income growth in the Indian economy
               affects environmental degradation at the maximum level (peak point).

               Table 7 shows the results of Model-2 established to test the RKC hypothesis.

