


Page 32 - Read Online
P. 32
Özbek et al. Carbon Footprints 2025, 4, 30  https://dx.doi.org/10.20517/cf.2025.43  Page 11 of 21

               FMOLS and CCR estimators
               The techniques commonly used in the literature to test the robustness of the estimation results obtained
               from the A-ARDL model are: FMOLS and CCR. Long-term coefficients can be obtained using these
               cointegration techniques.


               FMOLS, developed by Phillips and Hansen , offers a semi-parametric correction technique to eliminate
                                                    [66]
               the problems arising from the endogeneity problem between the variables examined in the model. Thus, the
               FMOLS estimator is obtained by eliminating the deviation and endogeneity problems in the OLS estimator.
               The FMOLS estimator eliminates the autocorrelation and endogeneity problems that occur in the OLS
               estimator, allowing more consistent results to be obtained in small samples.


                   [67]
               Park  proposed the CCR model for the coefficient estimates of the variables included in the cointegration
               model. CCR is closely related to FMOLS and, unlike FMOLS, it simultaneously corrects the variables used
               in the model. However, FMOLS performs the correction process in series, one by one. Using this method,
                                                                                          [67]
               Park demonstrated that efficient and unbiased estimators such as FMOLS can be achieved .
               Fourier bootstrap Toda-Yamamoto causality
                            [68]
               Nazlioglu et al.  proposed a new causality test formed by modeling gradual structural breaks with the
               Fourier function. This test is obtained by expanding the Toda-Yamamoto test with the trigonometric
               function. Enders and Jones  stated that if structural breaks are neglected, the established Vector
                                        [69]
               AutoRegressive (VAR) model will be underdefined and therefore incorrect hypothesis test results may
                                               [68]
               occur. Based on this, Nazlioglu et al.  added the Fourier function to the Toda-Yamamoto causality test
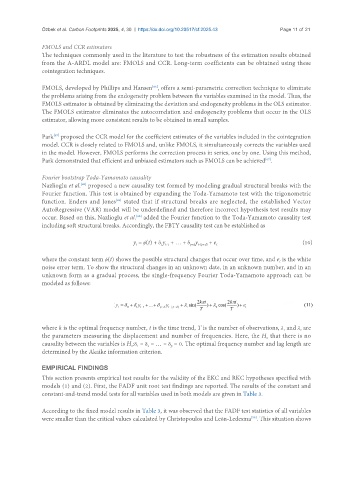
               including soft structural breaks. Accordingly, the FBTY causality test can be established as

                                              y = ϕ(t) + δ y  + … + δ y   + e                                                          (10)
                                                                 p+d t-(p+d)
                                                       1 t-1
                                               t
                                                                          t
               where the constant term ϕ(t) shows the possible structural changes that occur over time, and e is the white
                                                                                               t
               noise error term. To show the structural changes in an unknown date, in an unknown number, and in an
               unknown form as a gradual process, the single-frequency Fourier Toda-Yamamoto approach can be
               modeled as follows:


               where k is the optimal frequency number, t is the time trend, T is the number of observations, λ  and λ  are
                                                                                                      2
                                                                                                 1
               the parameters measuring the displacement and number of frequencies. Here, the H  that there is no
                                                                                           0
               causality between the variables is H :δ  = δ  = … = δ  = 0. The optimal frequency number and lag length are
                                                           p
                                             0 1
                                                   2
               determined by the Akaike information criterion.
               EMPIRICAL FINDINGS
               This section presents empirical test results for the validity of the EKC and RKC hypotheses specified with
               models (1) and (2). First, the FADF unit root test findings are reported. The results of the constant and
               constant-and-trend model tests for all variables used in both models are given in Table 3.


               According to the fixed model results in Table 3, it was observed that the FADF test statistics of all variables
               were smaller than the critical values calculated by Christopoulos and León-Ledesma . This situation shows
                                                                                      [58]

