


Page 27 - Read Online
P. 27
Page 6 of 21                    Özbek et al. Carbon Footprints 2025, 4, 30  https://dx.doi.org/10.20517/cf.2025.43

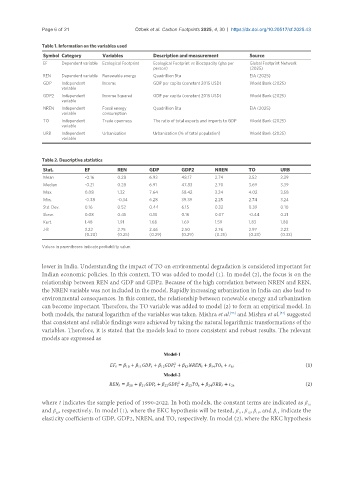
               Table 1. Information on the variables used
                Symbol Category     Variables        Description and measurement     Source
                EF    Dependent variable  Ecological Footprint  Ecological Footprint vs Biocapacity (gha per   Global Footprint Network
                                                     person)                         (2025)
                REN   Dependent variable  Renewable energy  Quadrillion Btu          EIA (2025)
                GDP   Independent   Income           GDP per capita (constant 2015 USD)  World Bank (2025)
                      variable
                GDP2  Independent   Income Squared   GDP per capita (constant 2015 USD)  World Bank (2025)
                      variable
                NREN  Independent   Fossil energy    Quadrillion Btu                 EIA (2025)
                      variable      consumption
                TO    Independent   Trade openness   The ratio of total exports and imports to GDP  World Bank (2025)
                      variable
                URB   Independent   Urbanization     Urbanization (% of total population)  World Bank (2025)
                      variable


               Table 2. Descriptive statistics
                Stat.         EF         REN       GDP        GDP2       NREN        TO         URB
                Mean          -0.16      0.28      6.93       48.17      2.74        3.52       3.39
                Median        -0.21      0.28      6.91       47.83      2.70        3.69       3.39
                Max.          0.08       1.32      7.64       58.42      3.24        4.02       3.58
                Min.          -0.38      -0.34     6.28       39.39      2.25        2.74       3.24
                Std. Dev.     0.16       0.52      0.44       6.15       0.32        0.39       0.10
                Skew.         0.08       0.45      0.10       0.16       0.07        -0.44      0.21
                Kurt.         1.48       1.91      1.68       1.69       1.59        1.83       1.80
                J-B           3.22       2.75      2.46       2.50       2.76        2.97       2.23
                              (0.20)     (0.25)    (0.29)     (0.29)     (0.25)      (0.23)     (0.33)

               Values in parentheses indicate probability value.

               lower in India. Understanding the impact of TO on environmental degradation is considered important for
               Indian economic policies. In this context, TO was added to model (1). In model (2), the focus is on the
               relationship between REN and GDP and GDP2. Because of the high correlation between NREN and REN,
               the NREN variable was not included in the model. Rapidly increasing urbanization in India can also lead to
               environmental consequences. In this context, the relationship between renewable energy and urbanization
               can become important. Therefore, the TO variable was added to model (2) to form an empirical model. In
               both models, the natural logarithm of the variables was taken. Mishra et al.  and Mishra et al.  suggested
                                                                                               [54]
                                                                               [53]
               that consistent and reliable findings were achieved by taking the natural logarithmic transformations of the
               variables. Therefore, it is stated that the models lead to more consistent and robust results. The relevant
               models are expressed as


               where t indicates the sample period of 1990-2022. In both models, the constant terms are indicated as β
                                                                                                         10
               and β , respectively. In model (1), where the EKC hypothesis will be tested, β , β , β , and β  indicate the
                                                                                              14
                    20
                                                                                       13
                                                                                 11
                                                                                    12
               elasticity coefficients of GDP, GDP2, NREN, and TO, respectively. In model (2), where the RKC hypothesis

