


Page 38 - Read Online
P. 38
Özbek et al. Carbon Footprints 2025, 4, 30  https://dx.doi.org/10.20517/cf.2025.43  Page 17 of 21

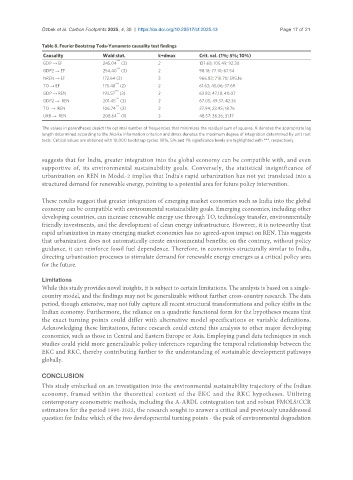
               Table 8. Fourier Bootstrap Toda-Yamamoto causality test findings
                Causality           Wald stat.        k+dmax        Crit. val. (1%; 5%; 10%)
                                        ***
                GDP → EF            245.04  (3)       2             137.68; 105.49; 92.30
                                        ***
                GDP2 → EF           254.40  (3)       2             98.18; 77.10; 67.54
                NREN → EF           172.64 (3)        3             966.83; 710.70; 595.16
                                        ***
                TO → EF             175.48  (2)       2             61.63; 45.06; 37.69
                                        ***
                GDP → REN           193.57  (3)       2             63.83; 47.18; 40.07
                                        ***
                GDP2 →  REN         201.45  (3)       2             67.05; 49.37; 42.36
                                        ***
                TO  →  REN          106.74  (3)       2             37.94; 23.95; 18.76
                                        ***
                URB →  REN          208.64  (1)       3             48.57; 36.36; 31.17
               The values in parentheses depict the optimal number of frequencies that minimizes the residual sum of squares. K denotes the appropriate lag
               length determined according to the Akaike information criterion and dmax denotes the maximum degree of integration determined by unit root
               tests. Critical values are obtained with 10,000 bootstrap cycles. 10%, 5% and 1% significance levels are highlighted with ***, respectively.

               suggests that for India, greater integration into the global economy can be compatible with, and even
               supportive of, its environmental sustainability goals. Conversely, the statistical insignificance of
               urbanization on REN in Model-2 implies that India's rapid urbanization has not yet translated into a
               structured demand for renewable energy, pointing to a potential area for future policy intervention.

               These results suggest that greater integration of emerging market economies such as India into the global
               economy can be compatible with environmental sustainability goals. Emerging economies, including other
               developing countries, can increase renewable energy use through TO, technology transfer, environmentally
               friendly investments, and the development of clean energy infrastructure. However, it is noteworthy that
               rapid urbanization in many emerging market economies has no agreed-upon impact on REN. This suggests
               that urbanization does not automatically create environmental benefits; on the contrary, without policy
               guidance, it can reinforce fossil fuel dependence. Therefore, in economies structurally similar to India,
               directing urbanization processes to stimulate demand for renewable energy emerges as a critical policy area
               for the future.

               Limitations
               While this study provides novel insights, it is subject to certain limitations. The analysis is based on a single-
               country model, and the findings may not be generalizable without further cross-country research. The data
               period, though extensive, may not fully capture all recent structural transformations and policy shifts in the
               Indian economy. Furthermore, the reliance on a quadratic functional form for the hypotheses means that
               the exact turning points could differ with alternative model specifications or variable definitions.
               Acknowledging these limitations, future research could extend this analysis to other major developing
               economies, such as those in Central and Eastern Europe or Asia. Employing panel data techniques in such
               studies could yield more generalizable policy inferences regarding the temporal relationship between the
               EKC and RKC, thereby contributing further to the understanding of sustainable development pathways
               globally.


               CONCLUSION
               This study embarked on an investigation into the environmental sustainability trajectory of the Indian
               economy, framed within the theoretical context of the EKC and the RKC hypotheses. Utilizing
               contemporary econometric methods, including the A-ARDL cointegration test and robust FMOLS/CCR
               estimators for the period 1990-2022, the research sought to answer a critical and previously unaddressed
               question for India: which of the two developmental turning points - the peak of environmental degradation

