


Page 71 - Read Online
P. 71
Page 12 of 24                     Luo et al. Carbon Footprints 2025, 4, 14  https://dx.doi.org/10.20517/cf.2024.53

                                                                   3
               Table 7. Summary statistics of traffic-derived NO  pollution exposure (µg/m )
                                                 2
                Period             Mean      Minimum        Maximum          Standard deviation
                Daytime            12.62     12.31          12.75            0.15
                Nighttime          6.62      6.58           6.67             0.02
                Morning peak       16.00     15.83          16.14            0.10
                Evening peak       18.41     18.13          18.63            0.15


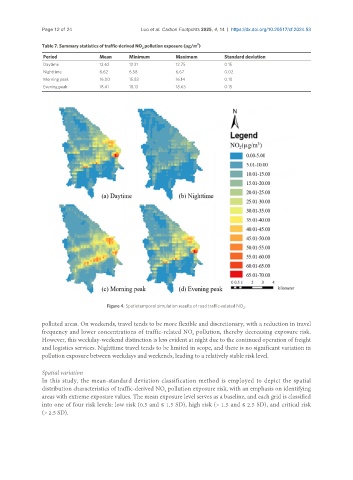
                                     Figure 4. Spatiotemporal simulation results of road traffic-related NO .
                                                                                   2
               polluted areas. On weekends, travel tends to be more flexible and discretionary, with a reduction in travel
               frequency and lower concentrations of traffic-related NO  pollution, thereby decreasing exposure risk.
                                                                  2
               However, this weekday-weekend distinction is less evident at night due to the continued operation of freight
               and logistics services. Nighttime travel tends to be limited in scope, and there is no significant variation in
               pollution exposure between weekdays and weekends, leading to a relatively stable risk level.


               Spatial variation
               In this study, the mean-standard deviation classification method is employed to depict the spatial
               distribution characteristics of traffic-derived NO  pollution exposure risk, with an emphasis on identifying
                                                         2
               areas with extreme exposure values. The mean exposure level serves as a baseline, and each grid is classified
               into one of four risk levels: low risk (0.5 and ≤ 1.5 SD), high risk (> 1.5 and ≤ 2.5 SD), and critical risk
               (> 2.5 SD).

