


Page 70 - Read Online
P. 70
Luo et al. Carbon Footprints 2025, 4, 14  https://dx.doi.org/10.20517/cf.2024.53  Page 11 of 24


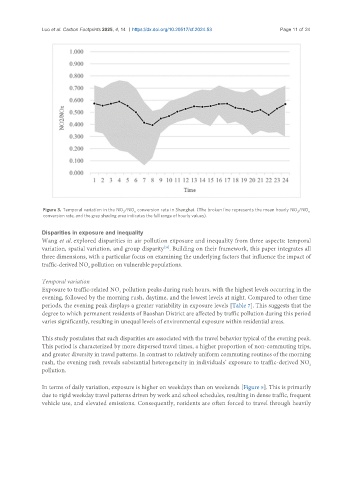
                Figure 3. Temporal variation in the NO /NO  conversion rate in Shanghai. (The broken line represents the mean hourly NO /NO   x
                                                                                                     2
                                           2
                                              x
                conversion rate, and the grey shading area indicates the full range of hourly values).
               Disparities in exposure and inequality
               Wang et al. explored disparities in air pollution exposure and inequality from three aspects: temporal
               variation, spatial variation, and group disparity . Building on their framework, this paper integrates all
                                                        [39]
               three dimensions, with a particular focus on examining the underlying factors that influence the impact of
               traffic-derived NO  pollution on vulnerable populations.
                               2
               Temporal variation
               Exposure to traffic-related NO  pollution peaks during rush hours, with the highest levels occurring in the
                                         2
               evening, followed by the morning rush, daytime, and the lowest levels at night. Compared to other time
               periods, the evening peak displays a greater variability in exposure levels [Table 7]. This suggests that the
               degree to which permanent residents of Baoshan District are affected by traffic pollution during this period
               varies significantly, resulting in unequal levels of environmental exposure within residential areas.

               This study postulates that such disparities are associated with the travel behavior typical of the evening peak.
               This period is characterized by more dispersed travel times, a higher proportion of non-commuting trips,
               and greater diversity in travel patterns. In contrast to relatively uniform commuting routines of the morning
               rush, the evening rush reveals substantial heterogeneity in individuals’ exposure to traffic-derived NO
                                                                                                         2
               pollution.


               In terms of daily variation, exposure is higher on weekdays than on weekends [Figure 5]. This is primarily
               due to rigid weekday travel patterns driven by work and school schedules, resulting in dense traffic, frequent
               vehicle use, and elevated emissions. Consequently, residents are often forced to travel through heavily

