


Page 67 - Read Online
P. 67
Page 8 of 24                      Luo et al. Carbon Footprints 2025, 4, 14  https://dx.doi.org/10.20517/cf.2024.53

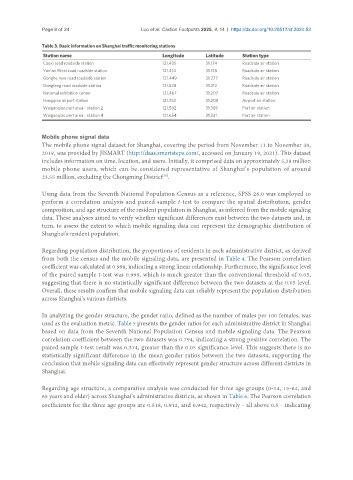
               Table 3. Basic information on Shanghai traffic monitoring stations
                Station name                            Longitude     Latitude     Station type
                Caoxi road roadside station             121.435       31.174       Roadside air station
                Yan'an West road roadside station       121.414       31.318       Roadside air station
                Gonghe new road roadside station        121.449       31.277       Roadside air station
                Dongfang road roadside station          121.528       31.212       Roadside air station
                National exhibition center              121.467       31.207       Roadside air station
                Hongqiao airport station                121.352       31.208       Airport air station
                Waigaoqiao port area - station 2        121.582       31.369       Port air station
                Waigaoqiao port area - station 4        121.654       31.331       Port air station


               Mobile phone signal data
               The mobile phone signal dataset for Shanghai, covering the period from November 11 to November 30,
               2019, was provided by JISMART (http://daas.smartsteps.com/, accessed on January 19, 2021). This dataset
               includes information on time, location, and users. Initially, it comprised data on approximately 5.28 million
               mobile phone users, which can be considered representative of Shanghai’s population of around
               23.55 million, excluding the Chongming District .
                                                        [39]

               Using data from the Seventh National Population Census as a reference, SPSS 26.0 was employed to
               perform a correlation analysis and paired sample t-test to compare the spatial distribution, gender
               composition, and age structure of the resident population in Shanghai, as inferred from the mobile signaling
               data. These analyses aimed to verify whether significant differences exist between the two datasets and, in
               turn, to assess the extent to which mobile signaling data can represent the demographic distribution of
               Shanghai's resident population.


               Regarding population distribution, the proportions of residents in each administrative district, as derived
               from both the census and the mobile signaling data, are presented in Table 4. The Pearson correlation
               coefficient was calculated at 0.998, indicating a strong linear relationship. Furthermore, the significance level
               of the paired sample t-test was 0.999, which is much greater than the conventional threshold of 0.05,
               suggesting that there is no statistically significant difference between the two datasets at the 0.05 level.
               Overall, these results confirm that mobile signaling data can reliably represent the population distribution
               across Shanghai’s various districts.


               In analyzing the gender structure, the gender ratio, defined as the number of males per 100 females, was
               used as the evaluation metric. Table 5 presents the gender ratios for each administrative district in Shanghai
               based on data from the Seventh National Population Census and mobile signaling data. The Pearson
               correlation coefficient between the two datasets was 0.794, indicating a strong positive correlation. The
               paired sample t-test result was 0.374, greater than the 0.05 significance level. This suggests there is no
               statistically significant difference in the mean gender ratios between the two datasets, supporting the
               conclusion that mobile signaling data can effectively represent gender structure across different districts in
               Shanghai.


               Regarding age structure, a comparative analysis was conducted for three age groups (0-14, 15-64, and
               65 years and older) across Shanghai’s administrative districts, as shown in Table 6. The Pearson correlation
               coefficients for the three age groups are 0.518, 0.912, and 0.942, respectively - all above 0.5 - indicating

