


Page 66 - Read Online
P. 66
Luo et al. Carbon Footprints 2025, 4, 14  https://dx.doi.org/10.20517/cf.2024.53  Page 7 of 24

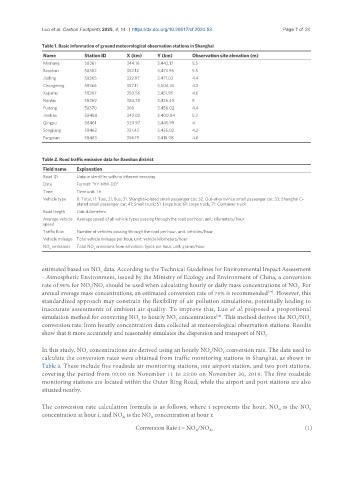
               Table 1. Basic information of ground meteorological observation stations in Shanghai
                Name          Station ID    X (km)    Y (km)      Observation site elevation (m)
                Minhang       58361         344.16    3,442.17    5.5
                Baoshan       58362         352.12    3,473.96    5.5
                Jiading       58365         332.97    3,471.03    4.4
                Chongming     58366         357.11    3,504.45    4.3
                Xujiahui      58367         350.56    3,451.95    4.6
                Nanhui        58369         384.38    3,436.49    5
                Pudong        58370         360       3,456.02    4.4
                Jinshan       58460         342.03    3,400.84    5.2
                Qingpu        58461         320.97    3,445.99    4
                Songjiang     58462         331.42    3,435.02    4.2
                Fengxian      58463         356.19    3,418.08    4.6


               Table 2. Road traffic emission data for Baoshan district
                Field name  Explanation
                Road ID    Unique identifier with no inherent meaning
                Date       Format: “YY-MM-DD”
                Time       Time unit: 1 h
                Vehicle type  0: Total; 11: Taxi; 21: Bus; 31: Shanghai-plated small passenger car; 32: Out-of-province small passenger car; 33: Shanghai C-
                           plated small passenger car; 41: Small truck; 51: Large bus; 61: Large truck; 71: Container truck
                Road length  Unit: kilometers
                Average vehicle  Average speed of all vehicle types passing through the road per hour, unit: kilometers/hour
                speed
                Traffic flow  Number of vehicles passing through the road per hour, unit: vehicles/hour
                Vehicle mileage Total vehicle mileage per hour, unit: vehicle kilometers/hour
                NO  emissions  Total NO  emissions from all vehicle types per hour, unit: grams/hour
                  x              x

               estimated based on NO  data. According to the Technical Guidelines for Environmental Impact Assessment
                                   x
               - Atmospheric Environment, issued by the Ministry of Ecology and Environment of China, a conversion
               rate of 90% for NO /NO  should be used when calculating hourly or daily mass concentrations of NO . For
                               2
                                                                                                     2
                                    x
               annual average mass concentrations, an estimated conversion rate of 75% is recommended . However, this
                                                                                           [37]
               standardized approach may constrain the flexibility of air pollution simulations, potentially leading to
               inaccurate assessments of ambient air quality. To improve this, Luo et al. proposed a proportional
               simulation method for converting NO  to hourly NO  concentrations . This method derives the NO /NO
                                                                          [38]
                                                x
                                                            2
                                                                                                     2
                                                                                                         x
               conversion rate from hourly concentration data collected at meteorological observation stations. Results
               show that it more accurately and reasonably simulates the dispersion and transport of NO .
                                                                                          2
               In this study, NO  concentrations are derived using an hourly NO /NO  conversion rate. The data used to
                                                                        2
                                                                            x
                              2
               calculate the conversion rates were obtained from traffic monitoring stations in Shanghai, as shown in
               Table 3. These include five roadside air monitoring stations, one airport station, and two port stations,
               covering the period from 00:00 on November 11 to 23:00 on November 30, 2019. The five roadside
               monitoring stations are located within the Outer Ring Road, while the airport and port stations are also
               situated nearby.
               The conversion rate calculation formula is as follows, where i represents the hour, NO  is the NO
                                                                                               2i
                                                                                                         2
               concentration at hour i, and NO  is the NO  concentration at hour i:
                                                    X
                                          Xi
                                               Conversion Rate i = NO /NO                                                                (1)
                                                                        Xi
                                                                   2i

