
Page 34 - Read Online
P. 34
Page 12 of 17 Hansen et al. Microstructures 2023;3:2023029 https://dx.doi.org/10.20517/microstructures.2023.17
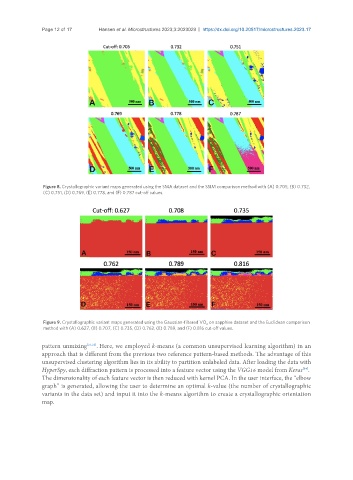
Figure 8. Crystallographic variant maps generated using the SMA dataset and the SSIM comparison method with (A) 0.705, (B) 0.732,
(C) 0.751, (D) 0.769, (E) 0.778, and (F) 0.787 cut-off values.
Figure 9. Crystallographic variant maps generated using the Gaussian-filtered VO on sapphire dataset and the Euclidean comparison
2
method with (A) 0.627, (B) 0.707, (C) 0.735, (D) 0.762, (E) 0.789, and (F) 0.816 cut-off values.
pattern unmixing [21,22] . Here, we employed k-means (a common unsupervised learning algorithm) in an
approach that is different from the previous two reference pattern-based methods. The advantage of this
unsupervised clustering algorithm lies in its ability to partition unlabeled data. After loading the data with
HyperSpy, each diffraction pattern is processed into a feature vector using the VGG16 model from Keras .
[34]
The dimensionality of each feature vector is then reduced with kernel PCA. In the user interface, the “elbow
graph” is generated, allowing the user to determine an optimal k-value (the number of crystallographic
variants in the data set) and input it into the k-means algorithm to create a crystallographic orientation
map.