
Page 29 - Read Online
P. 29
Hansen et al. Microstructures 2023;3:2023029 https://dx.doi.org/10.20517/microstructures.2023.17 Page 7 of 17
Table 1. Euclidean distance, Cosine, and SSIM similarity values compared to the reference pattern, along with the reliability values,
in the SMA sample
Diffraction pattern Similarity method
Euclidean Cosine SSIM
A 0.904 0.971 0.834
B 0.964 0.997 0.903
C 0.918 0.986 0.777
D 0.883 0.986 0.766
E 0.923 0.991 0.820
Reliability 1.044 1.006 1.083
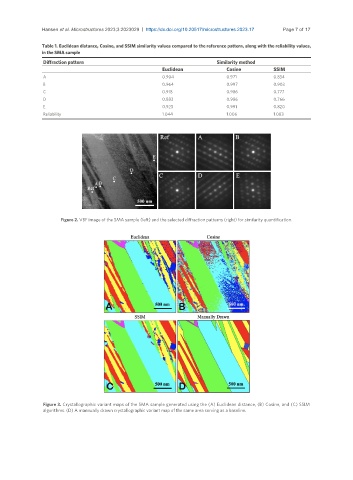
Figure 2. VBF image of the SMA sample (left) and the selected diffraction patterns (right) for similarity quantification.
Figure 3. Crystallographic variant maps of the SMA sample generated using the (A) Euclidean distance, (B) Cosine, and (C) SSIM
algorithms. (D) A mannually drawn crystallographic variant map of the same area serving as a baseline.