
Page 30 - Read Online
P. 30
Page 8 of 17 Hansen et al. Microstructures 2023;3:2023029 https://dx.doi.org/10.20517/microstructures.2023.17
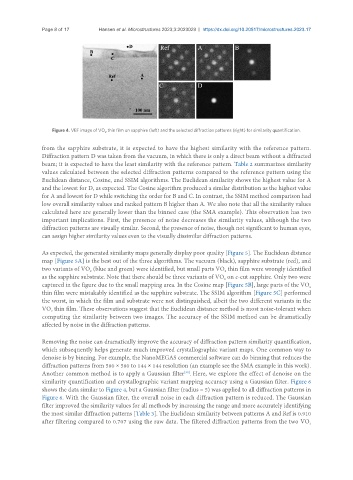
Figure 4. VBF image of VO thin film on sapphire (left) and the selected diffraction patterns (right) for similarity quantification.
2
from the sapphire substrate, it is expected to have the highest similarity with the reference pattern.
Diffraction pattern D was taken from the vacuum, in which there is only a direct beam without a diffracted
beam; it is expected to have the least similarity with the reference pattern. Table 2 summarizes similarity
values calculated between the selected diffraction patterns compared to the reference pattern using the
Euclidean distance, Cosine, and SSIM algorithms. The Euclidean similarity shows the highest value for A
and the lowest for D, as expected. The Cosine algorithm produced a similar distribution as the highest value
for A and lowest for D while switching the order for B and C. In contrast, the SSIM method comparison had
low overall similarity values and ranked pattern B higher than A. We also note that all the similarity values
calculated here are generally lower than the binned case (the SMA example). This observation has two
important implications. First, the presence of noise decreases the similarity values, although the two
diffraction patterns are visually similar. Second, the presence of noise, though not significant to human eyes,
can assign higher similarity values even to the visually dissimilar diffraction patterns.
As expected, the generated similarity maps generally display poor quality [Figure 5]. The Euclidean distance
map [Figure 5A] is the best out of the three algorithms. The vacuum (black), sapphire substrate (red), and
two variants of VO (blue and green) were identified, but small parts VO thin film were wrongly identified
2
2
as the sapphire substrate. Note that there should be three variants of VO on c-cut sapphire. Only two were
2
captured in the figure due to the small mapping area. In the Cosine map [Figure 5B], large parts of the VO
2
thin film were mistakably identified as the sapphire substrate. The SSIM algorithm [Figure 5C] performed
the worst, in which the film and substrate were not distinguished, albeit the two different variants in the
VO thin film. These observations suggest that the Euclidean distance method is most noise-tolerant when
2
computing the similarity between two images. The accuracy of the SSIM method can be dramatically
affected by noise in the diffraction patterns.
Removing the noise can dramatically improve the accuracy of diffraction pattern similarity quantification,
which subsequently helps generate much improved crystallographic variant maps. One common way to
denoise is by binning. For example, the NanoMEGAS commercial software can do binning that reduces the
diffraction patterns from 580 × 580 to 144 × 144 resolution (an example see the SMA example in this work).
Another common method is to apply a Gaussian filter . Here, we explore the effect of denoise on the
[39]
similarity quantification and crystallographic variant mapping accuracy using a Gaussian filter. Figure 6
shows the data similar to Figure 4, but a Gaussian filter (radius = 5) was applied to all diffraction patterns in
Figure 6. With the Gaussian filter, the overall noise in each diffraction pattern is reduced. The Gaussian
filter improved the similarity values for all methods by increasing the range and more accurately identifying
the most similar diffraction patterns [Table 3]. The Euclidean similarity between patterns A and Ref is 0.910
after filtering compared to 0.707 using the raw data. The filtered diffraction patterns from the two VO
2