
Page 145 - Read Online
P. 145
Page 4 of 11 Qin et al. Microstructures 2023;3:2023035 https://dx.doi.org/10.20517/microstructures.2023.34
Table 2. The rietveld refinement data of the observed XRD patterns for B F-BT ceramics
1+x
Phase fraction (%) Rhombohedral Cubic
x Rhombohedral Cubic 3 3 2
(R3c) (Pm m) a (Å) c (Å) V (Å ) a (Å) V (Å ) R wp X
-0.01 38 62 5.6454 13.8319 381.781 3.9989 63.948 8.0 1.41
0.00 54 46 5.6437 13.8376 381.704 3.9991 63.958 9.3 1.73
0.01 66 34 5.6393 13.8590 381.689 4.0045 64.281 8.8 1.49
0.02 65 35 5.6396 13.8614 381.805 4.0084 64.407 8.6 1.52
0.03 77 23 5.6389 13.8669 381.854 4.0063 64.303 9.5 1.74
0.04 74 26 5.6389 13.8654 381.812 4.0075 64.363 9.2 1.67
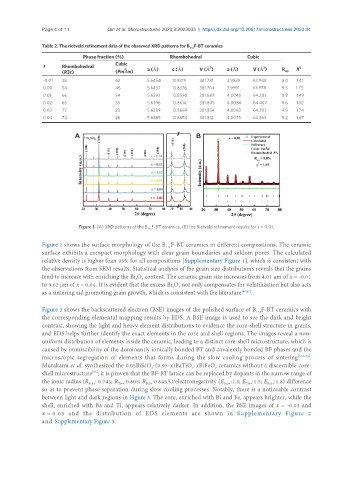
Figure 1. (A) XRD patterns of the B F-BT ceramics, (B) the Rietveld refinement results for x = 0.01.
1+x
Figure 2 shows the surface morphology of the B F-BT ceramics in different compositions. The ceramic
1+x
surface exhibits a compact morphology with clear grain boundaries and seldom pores. The calculated
relative density is higher than 95% for all compositions [Supplementary Figure 1], which is consistent with
the observations from SEM results. Statistical analysis of the grain size distributions reveals that the grains
tend to increase with enriching the Bi O content. The ceramic grain size increases from 4.01 μm of x = -0.01
3
2
to 9.62 μm of x = 0.04. It is evident that the excess Bi O not only compensates for volatilization but also acts
2
3
as a sintering aid promoting grain growth, which is consistent with the literature [46,47] .
Figure 3 shows the backscattered electron (BSE) images of the polished surface of B F-BT ceramics with
1+x
the corresponding elemental mapping results by EDS. A BSE image is used to see the dark and bright
contrast, showing the light and heavy element distributions to evidence the core-shell structure in grains,
and EDS helps further identify the exact elements in the core and shell regions. The images reveal a non-
uniform distribution of elements inside the ceramic, leading to a distinct core-shell microstructure, which is
caused by immiscibility of the dominantly ionically bonded BT and covalently bonded BF phases and the
microscopic segregation of elements that forms during the slow cooling process of sintering [3,53-56] .
Murakami et al. synthesized the 0.05BiScO -(0.95-x)BaTiO -xBiFeO ceramics without a discernible core-
3
3
3
shell microstructure ; it is proven that the BF-BT lattice can be replaced by dopants in the narrow range of
[53]
the ionic radius (R : 0.745; R :0.605; R :0.645Å)/electronegativity (E :1.3; E :1.5; E :1.8) difference
Fe3+
Sc3+
Ti4+
Sc3+
Ti4+
Fe3+
so as to prevent phase separation during slow cooling processes. Notably, there is a noticeable contrast
between light and dark regions in Figure 3. The core, enriched with Bi and Fe, appears brighter, while the
shell, enriched with Ba and Ti, appears relatively darker. In addition, the BSE images of x = -0.01 and
x = 0.03 and the distribution of EDS elements are shown in Supplementary Figure 2
and Supplementary Figure 3.