
Page 146 - Read Online
P. 146
Qin et al. Microstructures 2023;3:2023035 https://dx.doi.org/10.20517/microstructures.2023.34 Page 5 of 11
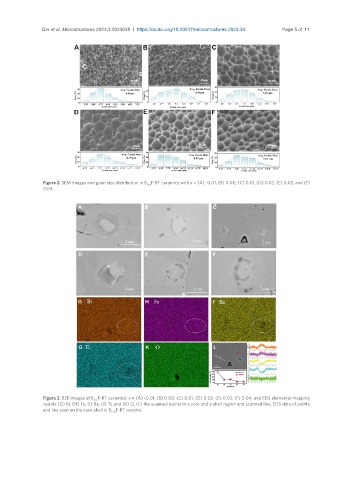
Figure 2. SEM images and grain size distribution in B F-BT ceramics with x = (A) -0.01, (B) 0.00, (C) 0.01, (D) 0.02, (E) 0.03, and (F)
1+x
0.04.
Figure 3. BSE images of B F-BT ceramics: x = (A) -0.01, (B) 0.00, (C) 0.01, (D) 0.02, (E) 0.03, (F) 0.04, and EDS elemental mapping
1+x
results (G) Bi, (H) Fe, (I) Ba, (J) Ti, and (K) O, (L) the scanned points in a core and a shell region and scanned line, EDS data of points
and line scan on the core-shell in B F-BT ceramic.
1.01