
Page 144 - Read Online
P. 144
Qin et al. Microstructures 2023;3:2023035 https://dx.doi.org/10.20517/microstructures.2023.34 Page 3 of 11
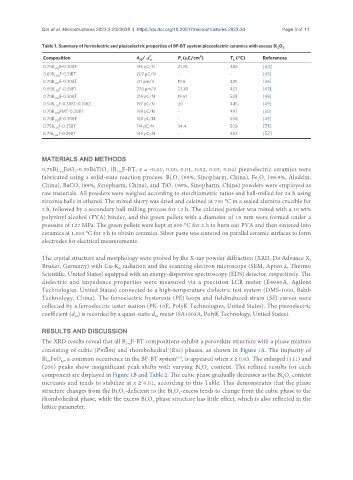
Table 1. Summary of ferroelectric and piezoelectric properties of BF-BT system piezoelectric ceramics with excess Bi O 3
2
2
Composition d / P (μC/cm ) T (°C) References
33
C
r
0.70B F-0.30BT 183 pC/N 21.38 480 [44]
1.02
0.69B 1.04 F-0.31BT 207 pC/N - - [45]
0.70B 1.02 F-0.30BT 211 pm/V 19.6 421 [46]
0.65B 1.05 F-0.35BT 270 pm/V 27.61 432 [47]
0.70B 1.02 F-0.30BT 214 pC/N 19.61 528 [48]
0.54B F-0.36BT-0.10BZ 197 pC/N 20 445 [49]
1.01
0.70B 1.02 FMT-0.30BT 198 pC/N - 497 [50]
0.70B F-0.30BT 180 pC/N - 506 [43]
1.05
0.75B 1.01 F-0.25BT 114 pC/N 34.4 508 [51]
0.71B F-0.29BT 142 pC/N - 452 [52]
1.04
MATERIALS AND METHODS
0.70Bi FeO -0.30BaTiO (B F-BT, x = -0.01, 0.00, 0.01, 0.02, 0.03, 0.04) piezoelectric ceramics were
3
1+x
1+x
3
fabricated using a solid-state reaction process. Bi O (99%, Sinopharm, China), Fe O (99.9%, Aladdin,
2
3
3
2
China), BaCO (99%, Sinopharm, China), and TiO (98%, Sinopharm, China) powders were employed as
2
3
raw materials. All powders were weighed according to stoichiometric ratios and ball-milled for 24 h using
zirconia balls in ethanol. The mixed slurry was dried and calcined at 750 °C in a sealed alumina crucible for
2 h, followed by a secondary ball-milling process for 12 h. The calcined powder was mixed with a 10 wt%
polyvinyl alcohol (PVA) binder, and the green pellets with a diameter of 10 mm were formed under a
pressure of 127 MPa. The green pellets were kept at 600 °C for 2 h to burn out PVA and then sintered into
ceramics at 1,010 °C for 3 h to obtain ceramics. Silver paste was sintered on parallel ceramic surfaces to form
electrodes for electrical measurements.
The crystal structure and morphology were probed by the X-ray powder diffraction (XRD, D8 Advance X,
Bruker, Germany) with Cu-K radiation and the scanning electron microscope (SEM, Apreo 2, Thermo
α
Scientific, United States) equipped with an energy-dispersive spectroscopy (EDS) detector, respectively. The
dielectric and impedance properties were measured via a precision LCR meter (E4980A, Agilent
Technologies, United States) connected to a high-temperature dielectric test system (DMS-1000, Balab
Technology, China). The ferroelectric hysteresis (PE) loops and fieldinduced strain (SE) curves were
collected by a ferroelectric tester station (PK-10E, PolyK Technologies, United States). The piezoelectric
coefficient (d ) is recorded by a quasi-static d meter (SA1303A, PolyK Technology, United States).
33
33
RESULTS AND DISCUSSION
The XRD results reveal that all B F-BT compositions exhibit a perovskite structure with a phase mixture
1+x
consisting of cubic (Pm m) and rhombohedral (R3c) phases, as shown in Figure 1A. The impurity of
Bi FeO , a common occurrence in the BF-BT system , is appeared when x ≥ 0.03. The enlarged (111) and
[37]
25
40
(200) peaks show insignificant peak shifts with varying Bi O content. The refined results for each
3
2
component are displayed in Figure 1B and Table 2. The cubic phase gradually decreases as the Bi O content
3
2
increases and tends to stabilize at x ≥ 0.01, according to this Table. This demonstrates that the phase
structure changes from the Bi O -deficient to the Bi O -excess tends to change from the cubic phase to the
2
3
2
3
rhombohedral phase, while the excess Bi O phase structure has little effect, which is also reflected in the
3
2
lattice parameter.