Page 148 - Read Online
P. 148

Qin et al. Microstructures 2023;3:2023035  https://dx.doi.org/10.20517/microstructures.2023.34                            Page 7 of 11

               Table 3. The values of R and C for each component at 325 °C derived based on the Z" and M"/ε  peak values for -0.01 ≤ x ≤ 0.04
                                                                                0
                              Component 1 (grain boundary)  Component 2 (shell)       Component 3 (core)
                Composition  R = 2 Z''   C = 1/(4πfZ'')   R = M''/(ε πf)   C = ε /(2M'')   R = M''/(ε πf)   C = ε /(2 M'')
                                                                                                 0
                                                                                        0
                                                              0
                                                                       0
                                                                        -1
                                           -1
                                                                                                 -1
                           (kΩ·cm)     (F cm )         (kΩ·cm)      (F cm )     (kΩ·cm)      (F cm )
                                             -10                          -10                      -9
                -0.01 (325 °C)  346    5.73 × 10       281          4.65 × 10   0.82         1.42 × 10
                0.00 (325 °C)  393     6.07 × 10 -10   315          4.77 × 10 -10  1.08      1.30 × 10 -9
                                             -10                          -10                      -9
                0.01 (325 °C)  474     3.48 × 10       378          2.88 × 10   0.95         1.06 × 10
                                             -10                          -10                      -9
                0.02 (325 °C)  438     5.45 × 10       329          4.16 × 10   1.12         1.14 × 10
                0.03 (325 °C)  314     5.25 × 10 -10   230          3.93 × 10 -10  0.99      1.08 × 10 -9
                                            -10                           -10                      -9
                0.04 (325 °C)  334     5.41 × 10       245          4.03 × 10   1.07         1.09 × 10


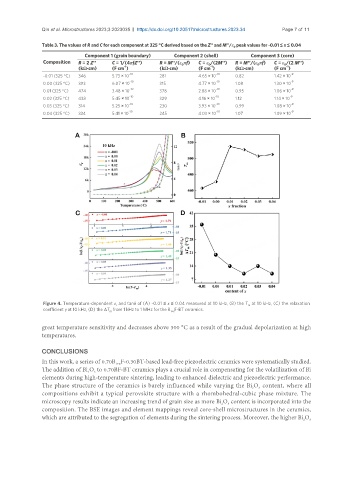
                Figure 4. Temperature-dependent ε  and tanδ of (A) -0.01 ≤ x ≤ 0.04 measured at 10 kHz, (B) the T  at 10 kHz, (C) the relaxation
                                        r                                            m
                coefficient γ at 10 kHz, (D) the ΔT  from 1 kHz to 1 MHz for the B F-BT ceramics.
                                      m                   1+x
               great temperature sensitivity and decreases above 300 °C as a result of the gradual depolarization at high
               temperatures.

               CONCLUSIONS
               In this work, a series of 0.70B F-0.30BT-based lead-free piezoelectric ceramics were systematically studied.
                                        1+x
               The addition of Bi O  to 0.70BF-BT ceramics plays a crucial role in compensating for the volatilization of Bi
                               2
                                 3
               elements during high-temperature sintering, leading to enhanced dielectric and piezoelectric performance.
               The phase structure of the ceramics is barely influenced while varying the Bi O  content, where all
                                                                                      2
                                                                                        3
               compositions exhibit a typical perovskite structure with a rhombohedral-cubic phase mixture. The
               microscopy results indicate an increasing trend of grain size as more Bi O  content is incorporated into the
                                                                            2
                                                                              3
               composition. The BSE images and element mappings reveal core-shell microstructures in the ceramics,
               which are attributed to the segregation of elements during the sintering process. Moreover, the higher Bi O
                                                                                                         3
                                                                                                       2
   143   144   145   146   147   148   149   150   151   152   153