
Page 149 - Read Online
P. 149
Page 8 of 11 Qin et al. Microstructures 2023;3:2023035 https://dx.doi.org/10.20517/microstructures.2023.34
*
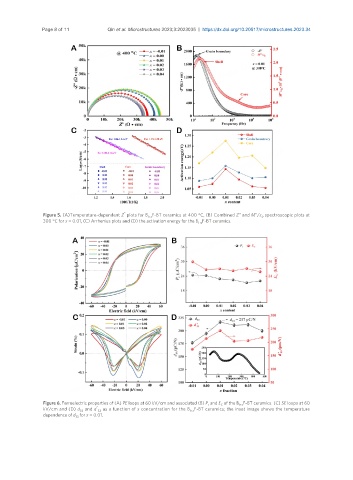
Figure 5. (A)Temperature-dependent Z plots for B F-BT ceramics at 400 °C, (B) Combined Z" and M"/ε spectroscopic plots at
1+x 0
300 °C for x = 0.01, (C) Arrhenius plots and (D) the activation energy for the B F-BT ceramics.
1+x
Figure 6. Ferroelectric properties of (A) PE loops at 60 kV/cm and associated (B) P and E of the B F-BT ceramics. (C) SE loops at 60
r
1+x
C
kV/cm and (D) d and d * 33 as a function of x concentration for the B F-BT ceramics; the inset image shows the temperature
33
1+x
dependence of d for x = 0.01.
33