
Page 96 - Read Online
P. 96
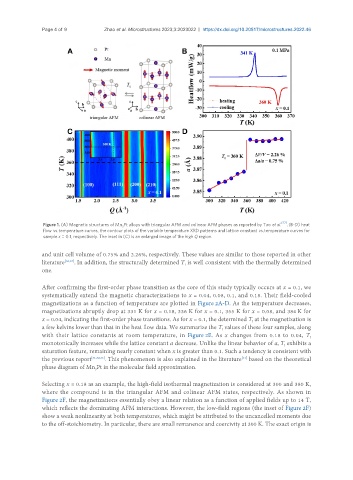
Page 4 of 9          Zhao et al. Microstructures 2023;3:2023022  https://dx.doi.org/10.20517/microstructures.2022.46


                Figure 1. (A) Magnetic structures of Mn Pt alloys with triangular AFM and colinear AFM phases as reported by Tao et al. [27] . (B-D) heat
                                          3
                flow vs. temperature curves, the contour plots of the variable temperature XRD patterns and lattice constant vs. temperature curves for
                sample x = 0.1, respectively. The inset in (C) is an enlarged image of the high Q region.

               and unit cell volume of 0.75% and 2.26%, respectively. These values are similar to those reported in other
               literature [36,37] . In addition, the structurally determined T  is well consistent with the thermally determined
                                                               t
               one.


               After confirming the first-order phase transition as the core of this study typically occurs at x = 0.1, we
               systematically extend the magnetic characterizations to x = 0.04, 0.08, 0.1, and 0.18. Their field-cooled
               magnetizations as a function of temperature are plotted in Figure 2A-D. As the temperature decreases,
               magnetizations abruptly drop at 331 K for x = 0.18, 336 K for x = 0.1, 355 K for x = 0.08, and 384 K for
               x = 0.04, indicating the first-order phase transitions. As for x = 0.1, the determined T at the magnetization is
                                                                                      t
               a few kelvins lower than that in the heat flow data. We summarize the T values of these four samples, along
                                                                            t
               with their lattice constants at room temperature, in Figure 2E. As x changes from 0.18 to 0.04, T
                                                                                                         t
               monotonically increases while the lattice constant a decrease. Unlike the linear behavior of a, T exhibits a
                                                                                                 t
               saturation feature, remaining nearly constant when x is greater than 0.1. Such a tendency is consistent with
               the previous report [31,32,36] . This phenomenon is also explained in the literature  based on the theoretical
                                                                                  [31]
               phase diagram of Mn Pt in the molecular field approximation.
                                 3
               Selecting x = 0.18 as an example, the high-field isothermal magnetization is considered at 300 and 380 K,
               where the compound is in the triangular AFM and colinear AFM states, respectively. As shown in
               Figure 2F, the magnetizations essentially obey a linear relation as a function of applied fields up to 14 T,
               which reflects the dominating AFM interactions. However, the low-field regions (the inset of Figure 2F)
               show a weak nonlinearity at both temperatures, which might be attributed to the uncancelled moments due
               to the off-stoichiometry. In particular, there are small remanence and coercivity at 300 K. The exact origin is