
Page 97 - Read Online
P. 97
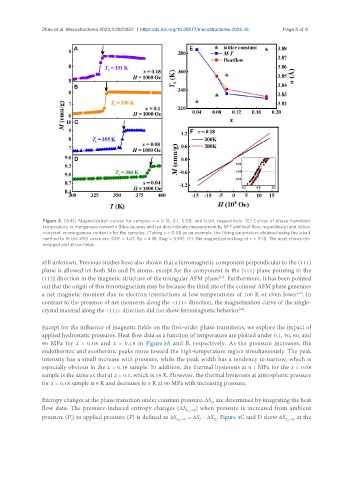
Zhao et al. Microstructures 2023;3:2023022  https://dx.doi.org/10.20517/microstructures.2022.46  Page 5 of 9


                Figure 2. (A-D) Magnetization curves for samples x = 0.18, 0.1, 0.08, and 0.04, respectively. (E) Curves of phase transition
                temperature vs. manganese content x (blue squares and red dots indicate measurement by M-T and heat flow, respectively) and lattice
                constant  vs. manganese content x for the samples. (Taking x = 0.08 as an example, the fitting parameters obtained using the lebail
                method to fit the XRD curve are: GOF = 1.47, Rp = 4.18, Rwp = 5.99). (F) The magnetization loop of x = 0.18. The inset shows the
                enlarged plot at low fields.

               still unknown. Previous studies have also shown that a ferromagnetic component perpendicular to the (111)
               plane is allowed on both Mn and Pt atoms, except for the component in the (111) plane pointing in the
               [112] direction in the magnetic structure of the triangular AFM phase . Furthermore, it has been pointed
                                                                           [31]
               out that the origin of this ferromagnetism may be because the third site of the colinear AFM phase generates
               a net magnetic moment due to electron interactions at low temperatures of 100 K or even lower . In
                                                                                                     [38]
               contrast to the presence of net moments along the <111> direction, the magnetization curve of the single-
               crystal material along the <111> direction did not show ferromagnetic behavior .
                                                                                 [34]

               Except for the influence of magnetic fields on the first-order phase transitions, we explore the impact of
               applied hydrostatic pressures. Heat flow data as a function of temperature are plotted under 0.1, 30, 60, and
               90 MPa for x = 0.08 and x = 0.18 in Figure 3A and B, respectively. As the pressure increases, the
               endothermic and exothermic peaks move toward the high-temperature region simultaneously. The peak
               intensity has a small increase with pressure, while the peak width has a tendency to narrow, which is
               especially obvious in the x = 0.18 sample. In addition, the thermal hysteresis at 0.1 MPa for the x = 0.08
               sample is the same as that at x = 0.1, which is 19 K. However, the thermal hysteresis at atmospheric pressure
               for x = 0.18 sample is 9 K and decreases to 5 K at 90 MPa with increasing pressure.

               Entropy changes at the phase transition under constant pressure, ΔS , are determined by integrating the heat
                                                                        P
                                                                   ) when pressure is increased from ambient
               flow data. The pressure-induced entropy changes (ΔS P 0 →P
               pressure (P ) to applied pressure (P) is defined as ΔS P 0 →P  = ΔS  - ΔS . Figure 3C and D show ΔS P 0 →P  at the
                         0
                                                                    P
                                                                         P 0