
Page 148 - Read Online
P. 148
Page 8 of 13 Sun et al. Vessel Plus 2020;4:13 I http://dx.doi.org/10.20517/2574-1209.2020.02
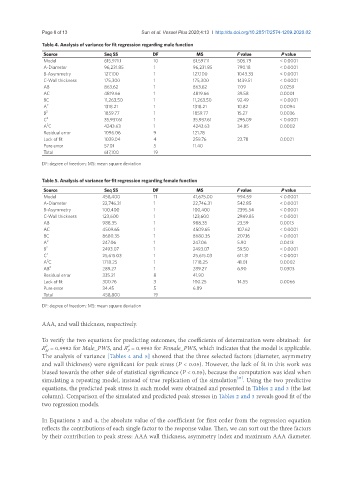
Table 4. Analysis of variance for fit regression regarding male function
Source Seq SS DF MS F value P value
Model 615,971.1 10 61,597.11 505.79 < 0.0001
A-Diameter 96,231.85 1 96,231.85 790.18 < 0.0001
B-Asymmetry 127,100 1 127,100 1043.33 < 0.0001
C-Wall thickness 175,300 1 175,300 1439.51 < 0.0001
AB 863.62 1 863.62 7.09 0.0259
AC 4819.66 1 4819.66 39.58 0.0001
BC 11,263.50 1 11,263.50 92.49 < 0.0001
A 2 1318.21 1 1318.21 10.82 0.0094
B 2 1859.77 1 1859.77 15.27 0.0036
C 2 35,937.61 1 35,937.61 295.09 < 0.0001
A C 4243.63 1 4243.63 34.85 0.0002
2
Residual error 1096.06 9 121.78
Lack of fit 1039.04 4 259.76 22.78 0.0021
Pure error 57.01 5 11.40
Total 617,100 19
DF: degree of freedom; MS: mean square deviation
Table 5. Analysis of variance for fit regression regarding female function
Source Seq SS DF MS F value P value
Model 458,400 11 41,675.00 994.59 < 0.0001
A-Diameter 22,746.31 1 22,746.31 542.85 < 0.0001
B-Asymmetry 100,400 1 100,400 2395.54 < 0.0001
C-Wall thickness 123,600 1 123,600 2949.85 < 0.0001
AB 988.35 1 988.35 23.59 0.0013
AC 4509.65 1 4509.65 107.62 < 0.0001
BC 8680.35 1 8680.35 207.16 < 0.0001
A 2 247.06 1 247.06 5.90 0.0413
B 2 2493.07 1 2493.07 59.50 < 0.0001
C 2 25,615.03 1 25,615.03 611.31 < 0.0001
2
A C 1718.25 1 1718.25 41.01 0.0002
AB 2 289.27 1 289.27 6.90 0.0303
Residual error 335.21 8 41.90
Lack of fit 300.76 3 100.25 14.55 0.0066
Pure error 34.45 5 6.89
Total 458,800 19
DF: degree of freedom; MS: mean square deviation
AAA, and wall thickness, respectively.
To verify the two equations for predicting outcomes, the coefficients of determination were obtained: for
2
2
R = 0.9982 for Male_PWS, and R = 0.9993 for Female_PWS, which indicates that the model is applicable.
M
F
The analysis of variance [Tables 4 and 5] showed that the three selected factors (diameter, asymmetry
and wall thickness) were significant for peak stress (P < 0.05). However, the lack of fit in this work was
biased towards the other side of statistical significance (P < 0.05), because the computation was ideal when
[21]
simulating a repeating model, instead of true replication of the simulation . Using the two predictive
equations, the predicted peak stress in each model were obtained and presented in Tables 2 and 3 (the last
column). Comparison of the simulated and predicted peak stresses in Tables 2 and 3 reveals good fit of the
two regression models.
In Equations 3 and 4, the absolute value of the coefficient for first order from the regression equation
reflects the contributions of each single factor to the response value. Then, we can sort out the three factors
by their contribution to peak stress: AAA wall thickness, asymmetry index and maximum AAA diameter.